Download
1 / 43
430 likes | 711 Vues
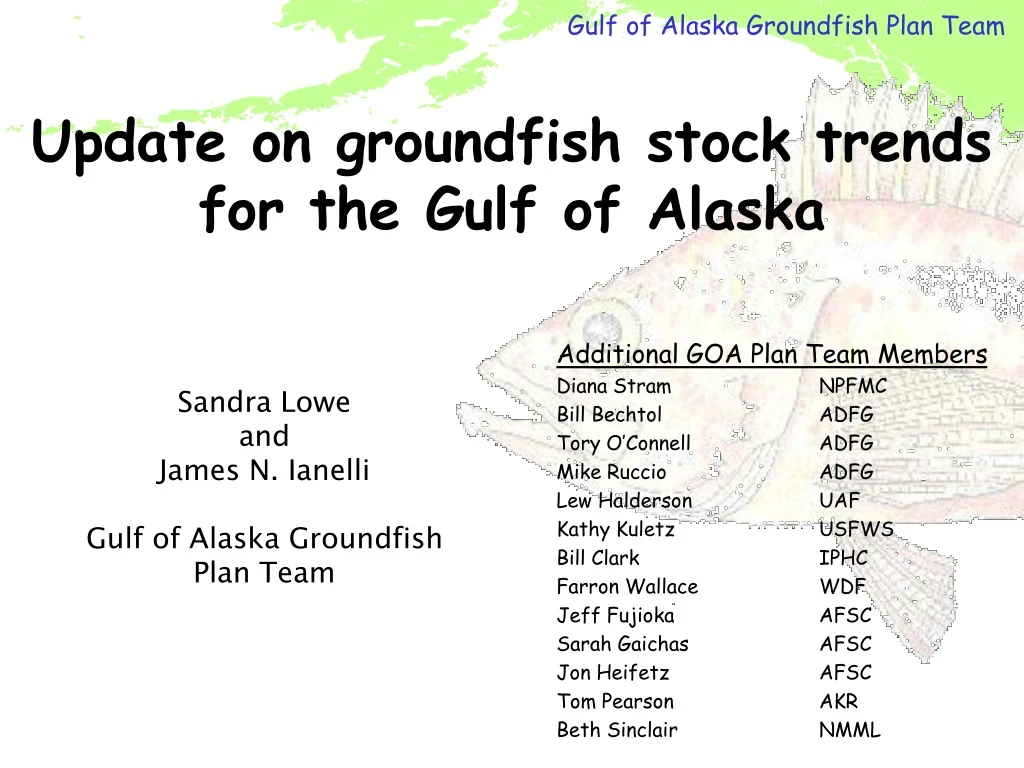
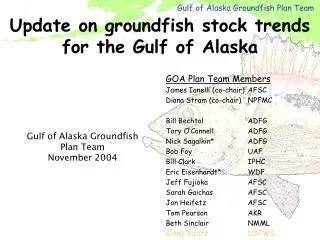
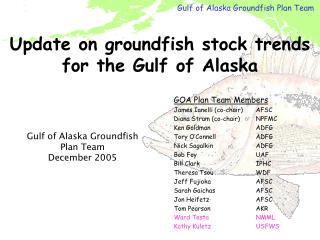
Update on groundfish stock trends for the Gulf of Alaska. Additional GOA Plan Team Members Diana Stram NPFMC Bill Bechtol ADFG Tory O’Connell ADFG Mike Ruccio ADFG Lew Halderson UAF Kathy Kuletz USFWS Bill Clark IPHC Farron Wallace WDF Jeff Fujioka AFSC Sarah Gaichas AFSC

E N D
Update on groundfish stock trends for the Gulf of Alaska Additional GOA Plan Team Members Diana Stram NPFMC Bill Bechtol ADFG Tory O’Connell ADFG Mike Ruccio ADFG Lew Halderson UAF Kathy Kuletz USFWS Bill Clark IPHC Farron Wallace WDF Jeff Fujioka AFSC Sarah Gaichas AFSC Jon Heifetz AFSC Tom Pearson AKR Beth Sinclair NMML Sandra Lowe and James N. Ianelli Gulf of Alaska Groundfish Plan Team
ABC Summary Species Change 2002 2003 Pollock 58,250 54,350 (7%) down 3,900 Pacific cod 57,600 52,800 (8%) down 4,800 Flatfish 63,900 63,690 down 210 (<1%) Flathead sole 22,690 41,390 up 18,700 (82%) Arrowtooth 146,260 155,140 up 8,880 (6%) 12,820 Sablefish 13,110 up 290 (2%) 13,190 Pacific ocean perch 13,660 up 470 (4%) 4,980 Northern rockfish 5,530 up 550 (11%) 1,620 Shortraker/Rougheye 1,620 same - 5,040 Other slope rockfish 5,050 up 10 - 5,490 Pelagic shelf rockfish 5,490 same - 350 Demersal shelf rockfish 390 up 40 (11%) Thornyheads 1,990 2,000 up 10 (1%) Atka mackerel 600 600 same - 414,820 up 20,040 (5%) 394,780 Total
Pollock Biomass or Recruitment Catch
Pollock Biomass
Pollockmodelresults Spawning biomass Recruitment
Added pollock conservation measures • Model selected • Survey catchability assumption fixed at 1.0 • Updated maturity-at-age used • Assuming average 1999 yearclass • Constant-buffer scheme used • No adjustments to the 2002 Shelikof Strait survey estimate
Pollock 2003 ABC 1999 year class as estimated Average 1999 year class Author's adjustment 49,600 86,000 Maximum permissible 59,200 102,000
2002 Prob(SSB<B20) = 0.21 2003, Prob(SSB<B20) = 0.02 2004, Prob(SSB<B20) = 0.00 20% 30% 40% 50% Percent of unfished
Pollock Spawning biomass • Spawning biomass (1,000’s tons) • 2003 = 177 • B40% = 240 • B20% = 120
ABC Summary Species Change 2002 2003 Pollock 58,250 54,350 (7%) down 3,900 Pacific cod 57,600 52,800 (8%) down 4,800 Flatfish 63,900 63,690 down 210 (<1%) Flathead sole 22,690 41,390 up 18,700 (82%) Arrowtooth 146,260 155,140 up 8,880 (6%) 12,820 Sablefish 13,110 up 290 (2%) 13,190 POP 13,660 up 470 (4%) 4,980 Northern rockfish 5,530 up 550 (11%) 1,620 Shortraker/Rougheye 1,620 same - 5,040 Other slope rockfish 5,050 up 10 - 5,490 Pelagic shelf rockfish 5,490 same - 350 Demersal shelf rockfish 390 up 40 (11%) Thornyheads 1,990 2,000 up 10 (1%) Atka mackerel 600 600 same - 414,820 up 20,040 (5%) 394,780 Total
Pacific cod • Notes: • Selectivity estimated over three stanzas:1978-86, 1987-99, & 2000 to the present • Risk-averse ratio applied to F40% • Steller sea lion prey species • Last survey in 2001 (next in 2003)
Pacific cod • Female spawning biomass (tons) • 2003 = 88,300 • B40% = 90,300 • B20% = 45,150
ABC Summary Species Change 2002 2003 Pollock 58,250 54,350 (7%) down 3,900 Pacific cod 57,600 52,800 (8%) down 4,800 Flatfish 63,900 63,690 down 210 (<1%) Flathead sole 22,690 41,390 up 18,700 (82%) Arrowtooth 146,260 155,140 up 8,880 (6%) 12,820 Sablefish 13,110 up 290 (2%) 13,190 Pacific ocean perch 13,660 up 470 (4%) 4,980 Northern rockfish 5,530 up 550 (11%) 1,620 Shortraker/Rougheye 1,620 same - 5,040 Other slope rockfish 5,050 up 10 - 5,490 Pelagic shelf rockfish 5,490 same - 350 Demersal shelf rockfish 390 up 40 (11%) Thornyheads 1,990 2,000 up 10 (1%) Atka mackerel 600 600 same - 414,820 up 20,040 (5%) 394,780 Total
Flathead sole • Female spawning biomass (tons) • 2003 = 93,500 • B40% = 38,100
ABC Summary Species Change 2002 2003 Pollock 58,250 54,350 (7%) down 3,900 Pacific cod 57,600 52,800 (8%) down 4,800 Flatfish 63,900 63,690 down 210 (<1%) Flathead sole 22,690 41,390 up 18,700 (82%) Arrowtooth 146,260 155,140 up 8,880 (6%) 12,820 Sablefish 13,110 up 290 (2%) 13,190 Pacific ocean perch 13,660 up 470 (4%) 4,980 Northern rockfish 5,530 up 550 (11%) 1,620 Shortraker/Rougheye 1,620 same - 5,040 Other slope rockfish 5,050 up 10 - 5,490 Pelagic shelf rockfish 5,490 same - 350 Demersal shelf rockfish 390 up 40 (11%) Thornyheads 1,990 2,000 up 10 (1%) Atka mackerel 600 600 same - 414,820 up 20,040 (5%) 394,780 Total
Sablefish • Notes • Survey abundance increased ~6% from 2001 estimate • Status “moderate” and increased from recent low levels (nearly at B40% level) • Authors proposed ABC recommendation based on estimates of probability of future stock sizes • Plan Team agreed with ABC (in general) but not the method
Sablefish spawning biomass • Spawning biomass (1,000’s tons) • 2003 = 210 • B40% = 216
ABC Summary Species Change 2002 2003 Pollock 58,250 54,350 (7%) down 3,900 Pacific cod 57,600 52,800 (8%) down 4,800 Flatfish 63,900 63,690 down 210 (<1%) Flathead sole 22,690 41,390 up 18,700 (82%) Arrowtooth 146,260 155,140 up 8,880 (6%) 12,820 Sablefish 13,110 up 290 (2%) 13,190 Pacific ocean perch 13,660 up 470 (4%) 4,980 Northern rockfish 5,530 up 550 (11%) 1,620 Shortraker/Rougheye 1,620 same - 5,040 Other slope rockfish 5,050 up 10 - 5,490 Pelagic shelf rockfish 5,490 same - 350 Demersal shelf rockfish 390 up 40 (11%) Thornyheads 1,990 2,000 up 10 (1%) Atka mackerel 600 600 same - 414,820 up 20,040 (5%) 394,780 Total
Rockfish spawning biomass • Spawning biomass (1,000’s tons) • POP: • 2003 = 112 • B40% = 105 • Northern: • 2003 = 43 • B40% = 25
Pelagic shelf rockfish: biomass Dusky, widow, & yellowtail
Pelagic shelf rockfish: catch Dusky, widow, & yellowtail
Thornyhead spawning biomass • Spawning biomass (1,000’s tons) • 2003 = 22.8 • B40% = 15.8


![Freshwater Variability on the Gulf of Alaska Shelf [ OS42A-01 ]](https://cdn2.slideserve.com/3972677/slide1-dt.jpg)