Download
1 / 79
790 likes | 1.23k Vues
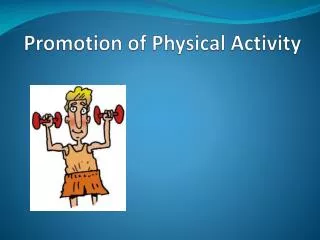
Promotion of Physical Activity for Obesity Prevention in Youth. Russell Pate Arnold School of Public Health University of South Carolina. Societal Trends Influencing Physical Activity. Non-Motorized Transportation.

E N D
Promotion of Physical Activity forObesity Prevention in Youth Russell Pate Arnold School of Public Health University of South Carolina
Societal Trends Influencing Physical Activity
Non-Motorized Transportation Percent of trips walked or biked by 5-15 year olds (McCann 2000)
Transportation to School How children get to school (US DOT 2000)
Transportation to School Percent of children walking and bicycling to school by country (CA Safe Routes to Schools 1996, Dept. of Transport 2001, Gilewe et al. 1998, Carlin et al. 1997)
Time Spent Viewing Television(Nielson Media Research) Hours Per Day
Percentage of children ages 3 to 5 who are enrolled in center based childhood care and education programs ChildStats.gov/ac2002
Enrolled in PEYRBS GRADE
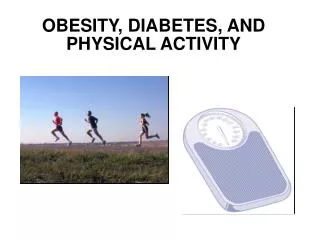
Increasing Prevalence of Childhood Obesity
Overweight (at or above 95th percentile of BMI) children and adolescents 6-19 years of age
Topics • Feasibility • Guidelines / Standards • Status • Promotion • Recommendations
Feasibility Of Preventing Obesity By Promoting Physical Activity in Youth
Physical Activity and Physical Fitness in African-American Girls With and Without Obesity Ward et al. Obesity Research 1997;5:572-577
Methods • 150 African American 5th grade students • BMI greater than 85th percentile • 54 with and 96 without obesity • Completed 3 days of physical activity recall • 3DPAR • Week days • After-school time Ward et al., 1997
Participation in Physical Activity 6 METs 4 METs Ward et al., 1997
Epstein et al. Health Psychology 1995;14:109-115 Effects of Decreasing Sedentary Behavior and Increasing Activity on Weight Changein Obese Children
Methods • Obese children • 8-12 years old • From 61 families • Randomized to treatment groups • Increased exercise • Decreased sedentary behaviors • Both • Followed for 1 year Epstein et al., 1995
Percent Overweight 0 4 8 12 P=.026 Months
Hypothetical Example • Pre-obesity • Age = 6 years • BMI =16.5 (12 % Fat) • Weight =22.7 Kg • Obesity • Age =12 years • BMI =28.7 (35% Fat) • Weight =64.5 Kg
Hypothetical Example • Weight Gain- Age 6-12 • 41.8 Kg • Fat Gain - Age 6-12 • 20.2 Kg • Excess Fat Gain- Age 6-12 • 13.1 Kg
Hypothetical Example • 100,870 Total Kcal • 16,812 Kcal/Yr • 323 Kcal/Wk • 46 Kcal/ Day
Healthy People 2010Physical Activity in Children and Adolescents • 22-6 Moderate physical activity in adolescents • 22-7Vigorous physical activity in adolescents • 22-8Physical education requirement in schools • 22-9Daily physical education in schools • 22-10 Physical activity in physical education class • 22-11Television viewing
Healthy People 2010Physical Activity in Children and Adolescents • 22-6 Increase to at least 30% the proportion of young people in grades 9-12 who engage in moderate physical activity for at least 30 minutes on five or more of the previous seven days.
Healthy People 2010Physical Activity in Children and Adolescents • 22-7 Increase to at least 85% the proportion of young people in grades 9-12 who engage in vigorous physical activity that promotes the development and maintenance of cardiorespiratory fitness 3 or more days per week for 20 or more minutes per occasion.
San Diego ConsensusPhysical Activity Guidelines for Adolescents • Guideline 1 • All adolescents should be physically active daily, or nearly everyday, as part of play, games, sports, and transportation, recreation, physical education, or physical exercise, in the context of family, school, and community activities.
San Diego ConsensusPhysical Activity Guidelines for Adolescents • Guideline 2 • Adolescents should engage in three or more sessions per week of activities that last 20 min or more at a time and that require moderate to vigorous levels of exertion.
Health Education Authority Recommendation 1 All children and youth should participate in physical activity that is of at least moderate intensity for an average of one hour per day. While young people should be physically active nearly every day, the amount of physical activity can appropriately vary from day to day in type, setting, intensity, duration, and amount.
Health Education Authority Recommendation 2 All children and youth should participate at least twice per week in physical activities that enhance and maintain strength in the musculature of the trunk and upper arm girdle.
How Active Are American Kids?
National Children and YouthFitness Study I • 1985 • n = 8,000 • National probability sample • Ages 10 - 18 • Six health-related fitness items • Extensive physical activity report • Itinerant testers
YRBS - 2001 • 13,627 students completed questionnaires • 50 states and the District of Columbia • 87 items • 7 physical activity items
Youth Risk Behavior SurveillanceYRBS • How many of the past 7 days • Exercised or did PA for at least 20 min that made you sweat and breathe hard • Participated in PA for at least 30 min that did not make you sweat or breathe hard • Do exercise to strengthen or tone your muscles
Youth Risk Behavior SurveillanceYRBS • On an average school day, how many hours do you watch TV • In an average week when in school, on how many days do you go to PE class • During an average PE class, how many min do you spend actually exercising or playing sports? • During the past 12 months, on how many sports teams did you play
CSA Monitor • Computer Science and Applications, Inc. • Model 7164 • Weighs 1.5 oz; 5x5x1.5 cm • Measures integrated accelerations in the vertical plane
Amherst Health and Activity Study • Subjects were recruited from 7 elementary schools, 1 junior high, and 1 senior high school • 38% of the 3648 students enrolled in PE returned consent forms (n=1379) • Subjects (n=400) were randomly selected to wear a CSA monitor for 7 days. • Subjects were divided into 4 grade groups, A=1-3, B=4-6, C=7-9 and D=grades 10-12.
Amherst Health & Activity Cut-Points METs=2.7570+(0.0015Countsmin-1)-(0.0896Age)-(0.000038x[counts min-1Age])
250 200 150 Minutes/Day 100 Male Female 50 0 A A B B C C D D Grade Group Median MVPA Minutes/Day * males > females (p<0.001) ^ all age groups significantly different (p<0.001) No significant age*gender interactions
35 30 25 20 Median number of minutes 15 10 Male 5 Female 0 A A B B C C D D Grade Group Median Vigorous Activity Minutes/Day * males > females (p<0.001) ^ all age groups significantly different (p<0.001) No significant age*gender interactions
8 7 6 5 Minutes/Day 4 3 Male 2 Female 1 0 A A B B C C D D Grade Group Median Very Vigorous Minutes * males > females (p<0.001) # all age groups significantly different (p<0.001) except C and D No significant age*gender interactions
100 90 80 70 60 Percentage 50 Males Females 40 30 20 10 0 A A B B C C D D Grade Group Percentage of children meeting HEA recommendation
Interventions To Promote Physical Activity In Youth