Download
1 / 49
500 likes | 636 Vues
AY202a Galaxies & Dynamics Lecture 14: Galaxy Centers & Active Galactic Nuclei. Galaxy Centers. History AGN Discovered way back when --- Fath 1908 Broad lines in NGC1068 Seyfert 1943 Strong central SB correlates with broad lines

E N D
AY202a Galaxies & DynamicsLecture 14:Galaxy Centers &Active Galactic Nuclei
Galaxy Centers History AGN Discovered way back when --- Fath 1908 Broad lines in NGC1068 Seyfert 1943 Strong central SB correlates with broad lines Growing evidence over the years that there was a central engine and that the central engine must be a black hole! And, what about galaxies that are not AGN?
Masers in NGC4258 microarcsec proper motions with VLBI
Reverberation Mapping Blandford & McKee ’82, Peterson et al. Assume 1. Continuum comes from a single central source 2. Light travel time is the most important timescale τ = r/c 3. There a simple (not necessarily linear) relation between the observed continuum and the ionizing continuum.
Continuum light curve relative to mean L(V,t) = ∫ (V,τ) C(t-τ) dτ Velocity delay map
N5548 Lag relative to 1350A = 12 days @ Lyα, 26 days @ CIII], 50 days @ MgII
Kaspi et al R vs L & M vs L From Reverberation Mapping
Greene & Ho Push to low M Log (M●/M) = 7.96 + 4.02 (σ/200 km/s)
Barth, Greene & Ho
BH Mass Function Greene & Ho ‘07
Active Galactic Nuclei 1943 Carl Seyfert Sy1 = Broad Balmer lines 104 km/s Sy2 = Intermediate width lines 103 1950’s Jansky, Ryle detected Radio Sources 1960’s Radio Galaxies ID’d Baade & Minkowski Virgo A = M87, Cygnus A, NGC5128, NGC1275 1963 Greenstein & Schmidt identified QSO’s (3C48 z=0.367, 3C273 z =0.158)
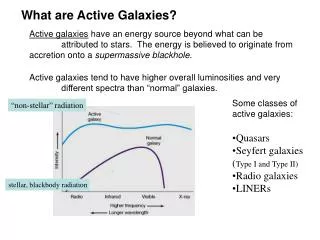
General Properties Compact central source energy density high, dominates host galaxy Non-thermal spectrum Optical/UV - general shows strong emission lines from dense and less dense regions. Polarization (1-10%), jets Radio – jets, lobes, compact sources X-rays --- Power law spectrum, often into the Mev Gamma rays --- detection of some sources like BL Lac’s into the TeV Variability
Classifications Sy1/QSO = Type I Broad permitted lines 104+ km/s narrower forbidden lines 103 km/s, BLRG QSR = radio loud, QQ = radio quiet Sy2 = Type II narrower lines, all ~ 103 km/s line ratios indicative of photoionization by a non-thermal (power law) spectrum, NLRG BL Lac = Blazar continuum emission only, usually strong radio and/or x-ray source, polarized LINER = Low ionization nuclear emission line region OVV = Optically Violent Variable QSO, Blazar
Hα NGC5940 Sy1 [OIII] H ns
Hα NGC4151 Sy1.2 [NII] [NII] [OI] [OI] [SII]
High S/N Optical Peterson
Spectral Classification by Line Ratio Seyferts/QSOs Baldwin, Terlevich & Phillips (based on Osterbrock) Star Forming LINER
Electron Density from Line Ratios Intensity ratio changes as collisional depopulation begins to dominate radiative radiative collisional [SII] doublet 6717 &6731A collisional Peterson, Pogge based on Osterbrock
Temperature from Line Ratios Relative population of states depends on temperature [OIII] 4363 and the 4959+5007 doublet Peterson, Pogge based on Osterbrock
Real or Memorex? Classification can depend on how you look --- total vs polarized. (Miller et al.) looks a lot like a Sy1!
Fanaroff-Riley Classification Fanaroff & Riley (1974) noted that radio source structure was correlated source luminosity FR I – weak sources, bright centers decreasing surface brightness to the edge FR II – have limb brightened regions of enhanced emission 1400 Mhz vs MB from Owen & Ledlow ‘94
FR I (3C449, Perley et al ’79) FR II (3C47, Bridle et al. ’94)
David W. Hogg, Michael R. Blanton, and the Sloan Digital Sky Survey Collaboration
David W. Hogg, Michael R. Blanton, and the Sloan Digital Sky Survey Collaboration
Cen A Chandra
Optical Radio X-ray Comp
Superluminal Motions 3C279 (NRAO) VLBI Keel
Consider two blobs, one stationary and one moving away from it at a velocity c at an angle of to the line-of-sight. Apparent transverse velocity is v = which has a maximum at v ~ c = 1/(1-2)1/2 c sin() 1- cos()
Basic Models 1959 Woltjer’s argument --- (1) centers of AGN very small, r < 100 pc, (2) typical line widths are v > 1000 km/s, so by GM/r ~ v2 M > 1010 (r/100pc) M So either M is really big, implying a very high mass density inside r, or r is much smaller, implying a very high energy density at the center - or both.
Continuum Spectrum best described as Synchrotron-Self Compton + thermal emission from an accretion disk + dust & stars, + lines from the gas. SSC Synchrotron spectrum with a low frequency turnover due to self absorption and a high frequency break due to Compton losses and an x-ray-HE spectrum from inverse Compton scattering from the relativistic electrons
Synchrotron Spectrum Depends on the energy spectrum of the electrons, e.g. for n(E) = N E–S /4 = W(E/mc2)–S /4 where E/mc2 is usually abbreviated as γ the power, P, emitted per unit volume is dP/dV = 1.7x10²¹ N a(S) B(4.3x10⁶ B/)(S-1)/2 (volume emissivity) ergs/s/cm3/Hz B = magnetic field in Gauss, a(s) ~0.1 for 1.5<S<5 power law spectrum slope is related to energy spectrum slope ~ (S-1)/2 See Ginzburg & Syrovatskii 1964, Sov AJ 9, 683 1965, AR 3, 297, 1969 AR 7, 375 Blumenthal & Gould 1970 Rev Mod Phys 42, 237
Synchrotron Peak @ m B1/5 F2/5 -4/5
Synchrotron Peak SSC Model fit to Mk501 spectrum (Konopelko 2003) Self-Compton
SED High and Low γ-ray states M. Boettcher
Accretion Disks To first order, assume it radiates as a black body F() = where T(r) is the disk temperature at radius r 2h2 1 c2 eh/kT(r) -1
Multi-component Models Malkan 1983
References B. Peterson, An Introduction to Active Galactic Nuclei (Cambridge 1997) J. Krolik, Active Galactic Nuclei (Princeton 1999)