Download
1 / 24
240 likes | 373 Vues
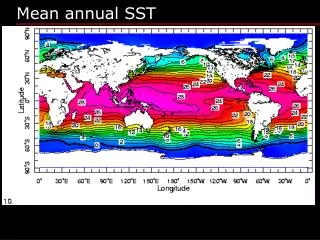
Mean annual GPP of Europe derived from its water balance. MDI-BGC, Max Planck Institute for Biogeochemistry, Germany Laboratoire des Sciences du Climat et de L'Environnement, France Research School of Biological Sciences, Australia Forect ecology Lab., University of Tuscia, Italy.

E N D
Mean annual GPP of Europe derived from its water balance • MDI-BGC, Max Planck Institute for Biogeochemistry, Germany • Laboratoire des Sciences du Climat et de L'Environnement, France • Research School of Biological Sciences, Australia • Forect ecology Lab., University of Tuscia, Italy Christian Beer1, Markus Reichstein1, Philippe Ciais2, Graham Farquhar3, Dario Papale4
Carbon fluxes in Zotino, Siberia. Lloyd et al., 2002 Carbon balance – observations at ecosystem level Eddy Covariance Technique Inventory
GPP TER Carbon balance at global scale: observations? • Global Scale: • Upscaling Inventory data • Models using • Remote Sensing Data (LUE) • Atm. [CO2] (transport inversion) • Climate & Soil data (TEMs)
GPP TER Carbon balance at global scale: observations? • Global Scale: • Upscaling Inventory data • Models using • Remote Sensing Data (LUE) • Atm. [CO2] (transport inversion) • Climate & Soil data (TEMs) ?
Ball et al., 1987 From Sellers et al., 1997 Objective Data-driven estimation of European mean GPP. • Making use of linkage between C and H2O cycles: • Scaling WUE from stand level to watersheds • Multiplying WUE with water balance of watersheds • Summing up GPP of watersheds
Outline Generalisation of WUE in forests WUE map of Europe Mean WUE and GPP of watersheds Uncertainties of European GPP number Plausibility
WHC at sites: Applying hydraulic parameters to reported soil texture classes (Cosby et al., 1984) FPC: Foliage Projective Cover Ecosystem-level WUE: Definitions • GPP & ET: • - NEE & LE from CE-IP database (Papale et al., 2006) • GPP derived by NEE partioning (Reichstein et al., 2005) • gap-filling of half-hourly data • aggregation to annual sums
Large variability of WUE between forest sites Station Species WUE [g/kg] BE-Vie Fagus 4.93 DE-Hai Fagus 5.15 DE-Tha Picea 4.59 DK-Sor Fagus 6.15 FI-Hyy Pinus 3.50 FI-Sod Pinus 2.90 FR-Hes Fagus 4.03 FR-LBr Pinus 3.08 FR-Pue Quercus 3.78 IT-Ro1 Quercus 3.03 NL-Loo Pinus 4.01 Environmental gradients!!
‚Leave-one-out validation‘ Generalisation of forest WUE 11 sets of (a1,a2,a3)
WUE map of Europe MODIS Land Cover Forest Grass/Cropland MODIS LAI, 1 km + European soil texture map, 1 km Mean WUEVPD: 18±5g*hPa/kg WUEVPD, 1 km (33 maps)
WUE map of Europe Mean WUEVPD of crop/grassland LAI Soil texture WUEVPD
WUE map of Europe WUEVPD, 1 km WUEVPD, 10 km WUE, 10 km VPD, 10 km
Watershed-wide GPP MODIS Land Cover Forest Grass/Cropland MODIS LAI, 1 km + European soil texture map, 1 km Mean WUEVPD: 18±5g*hPa/kg WUEVPD, 1 km (33 maps) WUEVPD, 10 km (33 maps) WUE, 10 km VPD, 10 km Precip for weighting average WUE, watershed ET=Precip-Runoff GPP, watershed
Watershed-wide GPP – Basis for European GPP estimate Reichstein et al., 2006
GPP result & uncertainties • 6 climate data sets: • VPD: • DAO 2000-2003 • REMO 1961-2003 • Precipitation: • GPCP 2000-2003 • CRU 1961-1990 • REMO 1961-2003 + 33 maps of WUEVPD GPP of Europe = 3.21±0.36 PgC/a (11% uncertainty) Not taken into account: Uncertainties due to soil texture, LAI, land cover
Discussion Missing productive land: ~ Six-fold area of Ireland with GPP=1000 gC/m²/a Underestimation of 0.4PgC/a (13%) Assuming GPP=1000 gC/m2/a for Gota, Iijoki, Oulujoki: Overestimation of 0.1PgC/a (3%)
Plausibility – Comparison of NPP assessments GPP = 3.2 PgC/a & NPP/GPP = 0.5 NPP ~ 1.6 PgC/a NPP(forest) ~ 0.8 PgC/a (Schulze et al., 1999 + Nabuurs et al., 2003) NPP(crop) ~ 0.5 PgC/a (Imhoff et al., 2004 + FAOSTAT, 2005) NPP(grass) ~ 1 PgC/a (PASIM model, Vuichard, 2007) Total: ~ 2.3 PgC/a Lower estimate compared to inventory!? Uncertainty of NPP/GPP ratio?
Conclusions GPP can be estimated by the water balance on global scale Challenge: Extrapolating WUE in space WUEVPD = f(WHC,LAI) Uncertainty of mean GPP at least 11%
Perspectives • Relationship WUEVPD=f(WHC,LAI) for grass? • Interannual GPP estimates by annual water balance (P-R) • Comparison of GPP anomalies to NEE anomalies by atmospheric CO2 inversions, or TEMs • Coupling such simple GPP model to inversions of atmospheric transport? (Comment by Christian Rödenbeck) Parameterisation of large-scale TEMs
Acknowledgments Eddy Flux Obs., Thank you! M. Aubinet (2x) C. Bernhofer (2x) K. Pilegaard A. Granier S. Rambal R. Valentini D. Lousteau T. Vesala E. Moors T. Laurila D. Schulze N. Buchmann, A. Knohl W. Kutsch G. Kiely H. Soegaard Z. Nagy Z. Barkza Z. Tuba Spatial Data: Joint Research Center: Soil texture map MODIS Team: Land Cover and LAI Gridded climate data by REMO, CRU, DAO Mean river discharge: The Global Runoff Data Centre, D-56002 Koblenz, Germany Comments during the ‚database workshop‘ in Amsterdam