Download
1 / 34
340 likes | 348 Vues
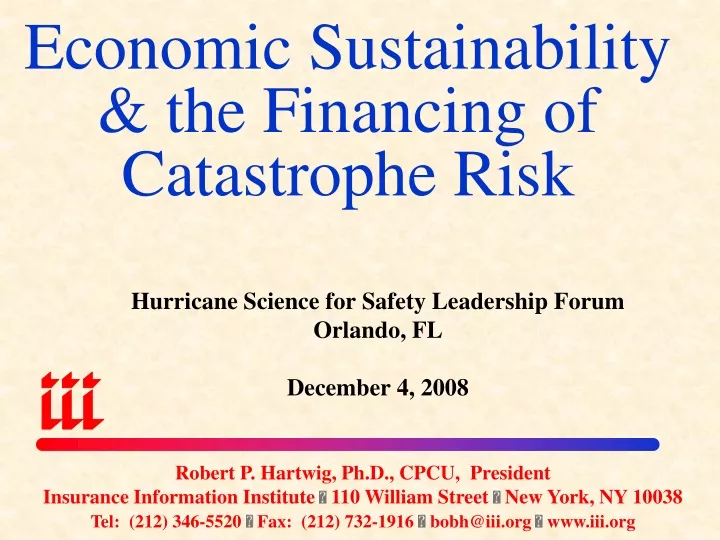
Economic Sustainability & the Financing of Catastrophe Risk. Hurricane Science for Safety Leadership Forum Orlando, FL December 4, 2008. Robert P. Hartwig, Ph.D., CPCU, President Insurance Information Institute 110 William Street New York, NY 10038

E N D
Economic Sustainability& the Financing of Catastrophe Risk Hurricane Science for Safety Leadership Forum Orlando, FL December 4, 2008 Robert P. Hartwig, Ph.D., CPCU, President Insurance Information Institute 110 William Street New York, NY 10038 Tel: (212) 346-5520 Fax: (212) 732-1916 bobh@iii.org www.iii.org
How Stretched is the Government’s Balance Sheet?Financial Crisis Forces Fiscal Prioritization
Government Has Committed $7.8 TrillionSo Far to Financial Services Bailout* $ Trillions Anatomy of the Bailout • Guarantees: Govt. is guaranteeing corporate bonds, money market funds and money in some deposit accounts • Investments: Govt. has purchased corporate stock and corporate debt and will buy mortgages • Loans: Companies are borrowing from the government, using hard-to-sell (illiquid) securities as collateral US government has effectively become the world’s largest insurer *As of 12/1/08. Sources: US Treasury Department; Federal Reserve; New York Times, “US Plans $800 Billion in Lending to Ease Crisis,” by Edmund Andrews, 11/26/08, p. A1; Insurance Information Institute research;
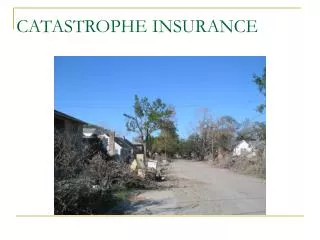
The Dollars and $ense of Hurricane Risk:An Insurance Industry Perspective
Most of US Population & Property Has Major CAT Exposure Is Anyplace Safe? Source: AIR Worldwide
2008 Was a Very Active and Destructive Hurricane Season Source: Wunderground.com
U.S. Insured Catastrophe Losses* $ Billions $100 Billion CAT year is coming soon 2008 CAT losses already exceed 2006/07 combined. 2005 was by far the worst year ever for insured catastrophe losses in the US, but the worst has yet to come. *Excludes $4B-$6b offshore energy losses from Hurricanes Katrina & Rita. **Based on preliminary PCS data through June 30. PCS $1.8B loss of for Gustav. $9.8B for Ike of 9/22. Note: 2001 figure includes $20.3B for 9/11 losses reported through 12/31/01. Includes only business and personal property claims, business interruption and auto claims. Non-prop/BI losses = $12.2B. Source: Property Claims Service/ISO; Insurance Information Institute
Top 12 Most Costly Disasters in US History, (Insured Losses, $2007) 10 of the 12 most expensive disasters ever were hurricanes; 8 of the top 10 hurricanes occurred since 2004 In 2008, Hurricane Ike became the 5th most expensive hurricane in US history and the 7th most expensive disaster ever. *2008 dollars Sources: ISO/PCS; AIR Worldwide, RMS, Eqecat; Insurance Information Institute inflation adjustments.
Landfalling Hurricanes: 1900-2007FL Landfalls are Common A hurricane strikes FL every other year on average—CAT 3+ every 4 years 1.7 hurricanes make landfall each year on average 38% of all hurricane landfalls occur in FL 37% of all FL landfalls are CAT 3+ Source: HURDAT database; Insurance Information Institute.
Inflation-Adjusted U.S. Insured Catastrophe Losses By Cause of Loss, 1987-2006¹ Insured disaster losses totaled $297.3 billion from 1987-2006 (in 2006 dollars). Wildfires accounted for approximately $6.6 billion of these—2.2% of the total. 1 Catastrophes are all events causing direct insured losses to property of $25 million or more in 2006 dollars. Catastrophe threshold changed from $5 million to $25 million beginning in 1997. Adjusted for inflation by the III. 2 Excludes snow. 3 Includes hurricanes and tropical storms. 4 Includes other geologic events such as volcanic eruptions and other earth movement. 5 Does not include flood damage covered by the federally administered National Flood Insurance Program. 6 Includes wildland fires. Source: Insurance Services Office (ISO)..
Total Value of Insured Coastal Exposure (2007, $ Billions) $522B increase since 2004, up 27% In 2007, Florida still ranked as the #1 most exposed state to hurricane loss, with $2.459 trillion exposure, an increase of $522B or 27% from $1.937 trillion in 2004. The insured value of all coastal property was $8.9 trillion in 2007, up 24% from $7.2 trillion in 2004. Source: AIR Worldwide
Florida & TexasFacing Economic Reality is Part of Sustainability
Underwriting Gain (Loss) in Florida Homeowners Insurance, 1992-2007E* Private Insurers** $ Billions Florida’s homeowners insurance market produces small/modest profits in most years and enormous losses in others *2007 estimate by Insurance Information Inst. based on historical loss, expense and premium data for FL. **Does not include Citizens Property Insurance Corporation results.
Cumulative Underwriting Gain (Loss) in Florida Homeowners Insurance, 1992-2007E* Private Insurers** Regulator under US law has duty to allow rates that are “fair,” “not excessive” and “not unduly discriminatory.” Reality is that regulators in CAT-prone states suppress rates. $ Billions It took insurers 11 years (1993-2003) to erase the UW loss associated with Andrew, but the 4 hurricanes of 2004 erased the prior 7 years of profits & 2005 deepened the hole. *2007 estimate by Insurance Information Inst. based on historical loss, expense and premium data for FL. **Does not include Citizens Property Insurance Corporation results.
ROE for Homeowners Insurance in Texas, 1992 – 2008E Average ROE in TX 1992 through 2008E was -0.17% Texas will need to allow insurers to earn risk appropriate rates of return that reflect huge losses in some years Ike took its toll on the TX home insurance market in 2008 Source: NAIC
CAPITAL & CAPACITY CONSIDERATIONS:INSURERS MUST PUT LARGE AMOUNTS OF CAPITAL AT RISK TO OFFER INSURANCE IN FLORIDA
Estimated New Insurance Capital Required to Support Growth in FL Homeownership, 2005-2015* Florida needs to attract about $500 million in fresh homeowners insurance capital in 2005 just to keep pace with demographic trends, rising to more than $1 billion per year by 2013. *Estimate assumes 1:1 premium-to-surplus ratio and continuation of CAGR in direct premiums written of 11% (actual rate for period 1996-2003). Source: Insurance Information Institute
U.S. Residual Market Exposure to Loss (Billions of Dollars) In the 17-year period between 1990 and 2007, total exposure to loss in the residual market (FAIR & Beach/Windstorm) Plans has surged 132 fold from $54.7bn in 1990 to $770.4bn in 2007. Source: PIPSO; Insurance Information Institute
Florida Citizens Annual Exposure to Loss (Billions of Dollars) Since its creation in 2002, total exposure to loss in Florida Citizens has increased by 184 percent, from $154.6bn to $439.1bn in 2008. *PIPSO Data. **Florida Citizens as of July 2008. Source: PIPSO; Florida Citizens; Zurich American Insurance Co; Insurance Information Institute
TWIA Growth In Exposure to Loss (Building & Contents Only, $ Billions) TWIA’s liability in-force for building & contents has surged by 450 percent in the last eight years from $12.1bn in 2000 to $66.6bn as of 08/31/08 Source: TWIA; Insurance Information Institute;
Major Residual Market Plan Estimated Deficits 2004/2005 (Millions of Dollars) Hurricane Katrina pushed all of the residual market property plans in affected states into deficits for 2005, following an already record hurricane loss year in 2004 * MWUA est. deficit for 2005 comprises $545m in assessments plus $50m in Federal Aid. Source: Insurance Information Institute
Flood InsuranceAnalysis of Flood Policy Purchase and Lapse Rates Since Katrina in Texas
NFIP Flood Policy Growth in Gulf States Since Katrina* The number of flood insurance policies sold in the Gulf states in the 2 years following Katrina increased by 21.6% There was a 40.5% increase in the number of flood policies sold in TX in the year after Katrina/Rita *Change from July 2005 through August 2007. Sources: NFIP ; Insurance Information Institute.
Percentage of NFIP Flood Policies Issued Since Katrina That Are Not Renewed* Flood policy nonrenewal rates in Gulf states are surprisingly high One out of four flood policies sold in TX in the year after Katrina/Rita was nonrenewed in the second year *Policies issued since July 2005 as of August 2007. **US figure is nonrenewal rate for all policies in force, average over 12 month period ending August 2007. Sources: NFIP ; Insurance Information Institute.
Florida for Sale: 24/7/365 Ft. Lauderdale West Palm Miami Beach
New Condo Construction inSouth Miami Beach, 2007-2009 • Number of New Developments: 15 • Number of Individual Units: 2,111 • Avg. Price of Cheapest Unit: $940,333 • Avg. Price of Most Expensive Unit: $6,460,000 • Range: $395,000 - $16,000,000 • Overall Average Price per Unit: $3,700,167* • Aggregate Property Value: At least $6 Billion *Based on average of high/low value for each of the 15 developments Source: Insurance Information Institute from www.miamicondolifestyle.com accessed April 5, 2007.
Great Miami Hurricane of 1926: Hurricane Damage Adjusted for Inflation, Growth in Coastal Properties, Real Growth in Property Values* (Billions of 2004 Dollars) Repeat of Great Miami Hurricane of 1926 could cause $500B in damage by 2020 given current demographic trends Track of 1926 storm *Includes damage form wind and storm surge but generally excludes inland flooding. Source: Roger Pielke and Christopher Landsea,December 2005; Insurance Info. Institute.
Excessive Catastrophe Exposure:Outcome of Economically & Politically Rational Decision Process? • Property Owners • Make economically rational decision to live in disaster-prone areas • Low cost of living, low real estate prices & rapid appreciation, low/no income tax, low property tax, rapid job growth • Government-run insurers (e.g., CPIC, NFIP) provide implicit subsidies by selling insurance at below-market prices with few underwriting restrictions • Government aid, tax deductions, litigation recovery for uninsured losses • No fear of death and injury • Local Zoning/Permitting Authorities • Allowing development is economically & politically rational & fiscally sound • Residential construction creates jobs, attracts wealth, increases tax receipts, stimulates commercial construction & permanent jobs, develops infrastructure • Increases local representation in state legislature & political influence • Property and infrastructure damage costs shifted to others (state and federal taxpayers, policyholders in unaffected areas) • Developers • Coastal development is a high-margin business • Financial interest reduced to zero after sale Source: Insurance Information Institute.
Excessive Catastrophe Exposure:Outcome of Economically & Politically Rational Decision Process? • State Legislators • Loathe to pass laws negatively impacting development in home districts • Local development benefits local economy and enhances political influence • Rapid development lessens need for higher income and property taxes • Can redistribute CAT losses to unaffected policyholders and taxpayers • Can suppress insurance prices via state insurance regulator, suppress pricing and weaken underwriting standards in state-run insurer & redistribute losses • Congressional Delegation • Home state development increases influence in Washington • Political representation, share of federal expenditures • Loathe to pass laws harming development in home state/district • Tax law promotes homeownership and actually produces supplemental benefits for property owners in disaster-prone areas • Large amounts of unbudgeted disaster aid easily authorized • Tax burden largely borne by those outside CAT zone & those with no representation (children & unborn) • President • Presidential disaster declarations and associated aid are increasing • Political benefits to making declarations and distributing large amounts of aid • Direct impact on favorability ratings & election outcomes • Losses can be distributed to other areas and the unrepresented Source: Insurance Information Institute.
Recommendations for Controlling Hurricane Exposure • Raise public awareness of risk • Mandatory risk disclosure in all residential real estate transactions • Require signed waivers if decline flood coverage that also waive rights to any and all disaster aid, or • Mandate flood coverage • Continue to strengthen & enforce of building codes • Allow markets to determine all property insurance rates • Role of state focused on difficult-to-insure or income issues • Increase incentives to mitigate • Require state-run insurer to charge actuarially sound rates and limit high value exposure • Require communities/counties to a financial stake in their catastrophe exposure • Reimburse disaster aid to state/federal government
Insurance Information Institute On-Line WWW.III.ORG If you would like a copy of this presentation, please give me your business card with e-mail address