Download
1 / 44
490 likes | 813 Vues
Introduction to Proteomics. Phil Charles CCMP. Overview of Talk. Overview of proteomics as a concept Techniques discussion 2D Gels and experimental design paradigms Proteomics mass spectrometry Identification Quantitation.

E N D
Introduction to Proteomics Phil Charles CCMP
Overview of Talk • Overview of proteomics as a concept • Techniques discussion • 2D Gels and experimental design paradigms • Proteomics mass spectrometry • Identification • Quantitation
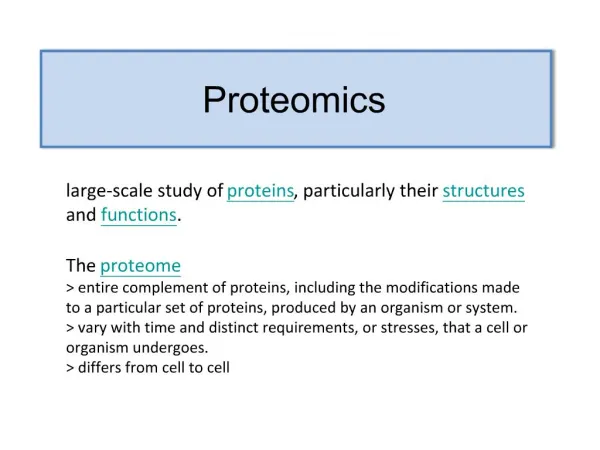
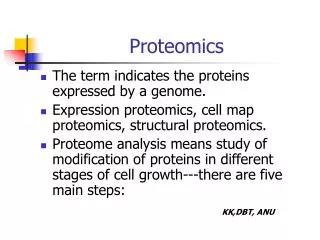
Proteomics is the study of the overall state of an organism’s temporal protein composition • The biological state of the proteome is encoded in • The relative abundance of currently expressed proteins (and their isoform) • Their localisation relative to cellular (or extracellular) structures • Their interaction partner molecules and substrates • Their current post-translational modification state • Their folded structures • …
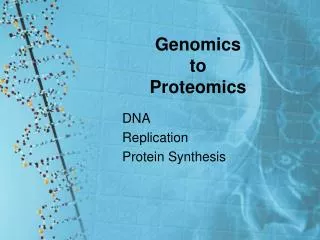
A Different View on Life • Different levels of biological complexity • More layers of regulation and control • Increased heterogeneity of samples Genome Transcriptome Proteome … Phenotype
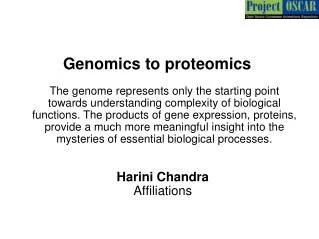
Why consider Proteomics? • Orthogonal verification of gene activity. • Observe biological state after more levels of regulation and control – closer to phenotypic outcome. • Observe proteomes of extracellular locations – blood plasma/serum, urine etc.
Proteomics • Classical biochemistry • Two-dimensional gels (2DGE) • Mass spectrometry • Computational analysis
Methods in Proteomics • Separation • Gels • Immunochemistry • Chromatography • Identification • Immunochemistry • Mass spectrometry • Quantitation • All of the above
Identification vs Quantitation • What’s there? How much of it is there? • How sure are you about the ID? • How sure are you about the abundance? • Not there versus not detectable
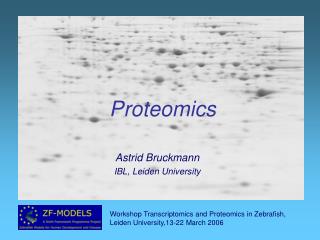
2DGE • Separate proteins by isoelectric point, then by mass • Visualise with silver staining or coomassie • Use CyDyes to label samples so they can be run together on the same gel ApplMicrobiolBiotechnol. 2007 October; 76(6): 1223–1243.
Quantitation Experimental Paradigm - Labelling • Label samples in such a way as to not affect subsequent processing but allow differentiation in final analysis. Examples: • Fluorescent dyes (2DGE) • SILAC amino acid labels (MS) • Isobaric mass tags (MS/ MS) • Process multiple samples simultaneously, differentiate only in final analysis on basis of label. • Avoid some proportion of technical variance • Best to worst (for avoiding technical variance): • Labelling in vivo • Labelling protein mixture • Labelling peptide digestion mixture
Aline Chrétien, EdouardDelaive, Marc Dieu, Catherine Demazy, NoëlleNinane, Martine Raes, Olivier Toussaint • Upregulation of annexin A2 in H2O2-induced premature senescence as evidenced by 2D-DIGE proteome analysis • Experimental Gerontology, Volume 43, Issue 4, April 2008, Pages 353–359
Quantitation Experimental Paradigm – Normalising to standard • Combine each sample (labelled with one label) with a representative standard (labelled with another label). • Perform analysis • For each protein in each run, normalise observed abundance in labelled sample to observed abundance in labelled standard.
Normalised Abundance Normalised Abundance Normalised Abundance Statistical Analysis
Mass Spectrometry • Mass Spectrometry is a technique for the detection and resolution of a sample of ions by their mass-to-charge ratio - represented by m/z where m is the mass in Daltons and z is the charge. ’
Proteomic Mass Spectrometry • Classical biochemistry techniques and 2DGE are, in general, ‘top-down proteomics’ – identify and quantify whole proteins. • Most modern proteomic MS is ‘bottom-up’
Shotgun/’bottom-up’ proteomics LNDLEEALQQAKEDLAR NKLNDLEEALQQAK NVQDAIADAEQR SKEEAEALYHSK SLVGLGGTK TAAENDFVTLK TAAENDFVTLKK TSQNSELNNMQDLVEDYK TSQNSELNNMQDLVEDYKK VDLLNQEIEFLK YEELQVTVGR YLDGLTAER ADLEMQIESLTEELAYLK ADLEMQIESLTEELAYLKK AETECQNTEYQQLLDIK LNDLEEALQQACEDLAR N KLNDLEEALQQAK IPI:IPI00000073.2 IPI:IPI00217963.3 IPI:IPI00031065.1 IPI:IPI00376379.4 IPI:IPI00397801.4 IPI:IPI00009950.1 IPI:IPI00395488.2 IPI:IPI00295414.7 IPI:IPI00554711.3 IPI:IPI00009867.3 IPI:IPI00019449.1 IPI:IPI00016915.1 IPI:IPI00060800.5 IPI:IPI00013885.1 IPI:IPI00221224.6 Observed Proteins + Quantitation Proteins Separation SDS-PAGE Antibody-based approaches Peptides Separation SCX High pH RP LC Low pH RP LC Analysis MS-MS/ Tandem MS Peptide IDs + Quantitation Digestion
Tandem Mass Spectrometry Mass Spectrum Mass Analyser + Detector Sample Intensity Intensity m/z Tandem Mass Spectrum MS/MS spectrum m/z Mass Analyser + Detector
Identification by MS/MS Mass Analyser + Detector • Search fragment spectrum against a database of protein sequences. For each sequence, digest into peptides, generate an expected fragment ion spectrum, and match to observed spectrum Intensity Intensity m/z m/z ? IITHPNFNGNTLDNDIMLIK
Identification by MS/MS • There are multiple commonly used MS/MS fragment spectra search engines, including: • Mascot • Sequest • OMSSA • X!Tandem • MS Amanda • Andromeda • ProteinPilot
A brief overview of Mass Spectrometric quantitation Please feel free to stop me and ask questions!
Tandem Mass Spectrometry Mass Spectrum Mass Analyser + Detector Sample Intensity Intensity m/z Tandem Mass Spectrum MS/MS spectrum m/z Mass Analyser + Detector
Select Peptide Ions Low pH Reverse Phase LC ‘Survey Scan’/ ‘MS1’/ ‘MS Scan’ Fragmentation CID Also ETD, PQD,HCD ‘Fragment Ions Scan’/ ‘MS2’/ ‘MS/MS Scan’ Data-Dependent Acquisition (DDA) time
Intensity Retention Time m/z
Intensity Intensity Retention Time m/z m/z
Peptide Isotopomer Distribution This is all 1 peptide Intensity Think of it as a frequency distribution based on a probability function. The relative intensity of each peak is the relative chance of a single peptide molecule having that m/z m/z 1/charge (z)
Intensity Intensity Retention Time m/z m/z
Intensity Intensity Intensity m/z Retention Time m/z IITHPNFNGNTLDNDIMLIK m/z
Quantitation Labelling Strategies • MS-based strategies • In-vivo labelling (compare peak pairs) • SILAC, 15N, 18O, 2H • MS/MS-based strategies • Isobaric Tags • iTRAQ, TMT
Intensity Intensity Intensity m/z Retention Time m/z m/z
Intensity Intensity Intensity m/z Retention Time m/z m/z
Intensity Intensity Intensity m/z Retention Time m/z IITHPNFNGNTLDNDIMLIK m/z
Intensity Intensity Intensity m/z Retention Time m/z m/z
Intensity Retention Time m/z
MS quantitation - peak pair comparison Intensity Retention Time m/z
Intensity Retention Time m/z
Intensity Retention Time m/z
ID Intensity ID ID ID ID Retention Time m/z
Identification vs Quantitation • What’s there? How much of it is there? • How sure are you about the ID? • How sure are you about the abundance? • Not there versus not detectable
Quantitation Software • MaxQuant • Progenesis LC-MS • ABI Peaks • Thermo ProteomeDiscoverer • + bespoke and specific tools
The Oxford Central Proteomics Facility • CCMP/CPF – Kessler Lab – WTCHG • CPF - Ben Thomas – Dunn School • Computational Biology Research group - WIMM
Thank you for your attention Please feel free to ask questions