Download
1 / 4
40 likes | 74 Vues
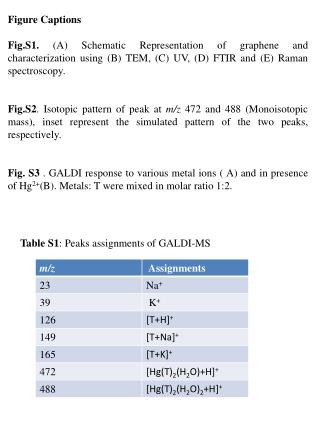
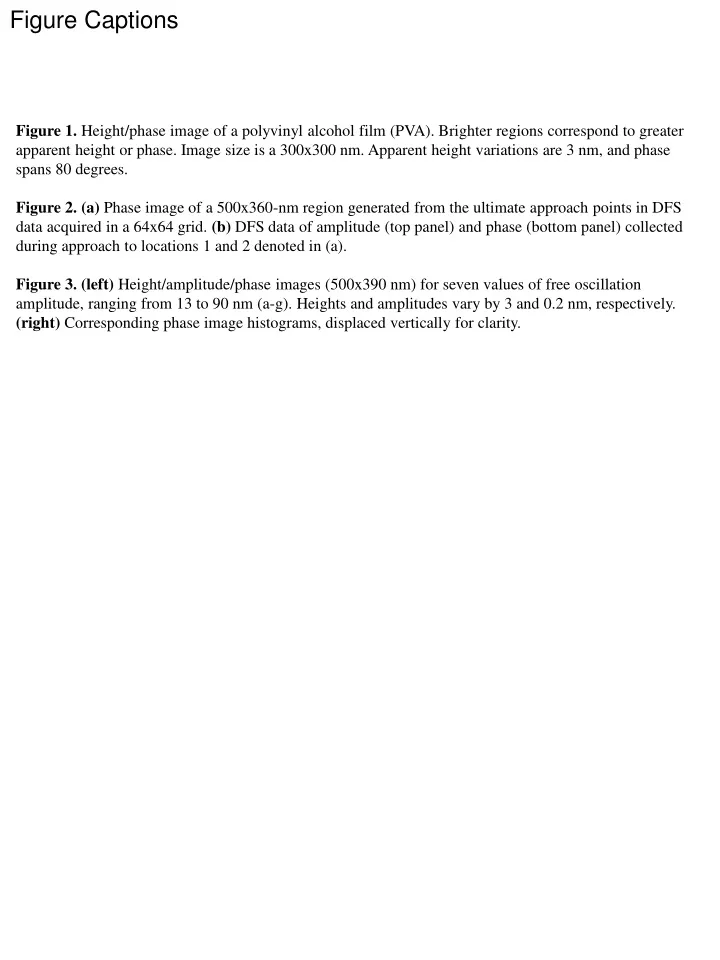
Figure Captions. Figure 1. Height/phase image of a polyvinyl alcohol film (PVA). Brighter regions correspond to greater apparent height or phase. Image size is a 300x300 nm. Apparent height variations are 3 nm, and phase spans 80 degrees.

E N D
Figure Captions Figure 1. Height/phase image of a polyvinyl alcohol film (PVA). Brighter regions correspond to greater apparent height or phase. Image size is a 300x300 nm. Apparent height variations are 3 nm, and phase spans 80 degrees. Figure 2.(a) Phase image of a 500x360-nm region generated from the ultimate approach points in DFS data acquired in a 64x64 grid. (b) DFS data of amplitude (top panel) and phase (bottom panel) collected during approach to locations 1 and 2 denoted in (a). Figure 3. (left) Height/amplitude/phase images (500x390 nm) for seven values of free oscillation amplitude, ranging from 13 to 90 nm (a-g). Heights and amplitudes vary by 3 and 0.2 nm, respectively. (right) Corresponding phase image histograms, displaced vertically for clarity.
Figure 1 Height Phase
Figure 2 1 2 (a) Amplitude (nm) Phase (deg) (b)
Figure 3 (g) (f) (e) (d) (c) (b) (a) Height Amplitude Phase