Download
1 / 43
430 likes | 543 Vues
Data Analysis in a PSSA World. Connecting Data to Student Success. Presented by: Joanne Galardy Michael Leitera Ron Saul. For those that don’t know us…. Riverside is located an hour North of Pittsburgh(Ellwood City) Double A school district 33% free and reduced lunch

E N D
Data Analysis in a PSSA World Connecting Data to Student Success Presented by: Joanne Galardy Michael Leitera Ron Saul .
For those that don’t know us… • Riverside is located an hour North of Pittsburgh(Ellwood City) • Double A school district • 33% free and reduced lunch • Limited funding- used Project 720 grant/CFF • Rural • Approximately 140 per graduating class, shrinking • 9-12 building • 600 students • Issues – class sizes, subgroups (IEP, econ disadvantaged), half day vocational program (3 periods a day)
Our Story • Partnered with OnHands “data retreat” • We had to get granular! • Data teams –9-12 English and Math-monthly meetings • Examine from program level to student level • We looked at grade level content results • We developed classroom plans • We developed student level plans • Make adjustments along the way! • We combined this with what is actually tested- Prioritizing the content!
Gestalt • It created more questions!!!! • Look at our data use as a whole • Are we asking the right curriculum questions? • Are we assessing students appropriately? • Inflated grades- PSSA, SAT, AP, ACT • Panoramic data- what else besides the tests? • Student / stakeholder role in improvement • Capacity- more time, personnel, professional development • What follows is the fruition of the efforts of two teachers that “bought in” and created a synergy between the data teams and technology (CFF, Study Island)
Benchmarks Sharing benchmark scores with students at the start of the school year is the first step in developing a team approach to shared goals. How can teachers collaborate on shared goals? http://riverside-communications-english.wikispaces.com/ .
Can we get there from here?What is our first step? From the first day of school, we discuss that we will move toward proficiency together. Our successes will be celebrated and we will remain cautiously optimistic with each assessment.
Who has the Responsibility? • All the teachers in the school. • We must incorporate out of discipline classes (Social Studies, Business, Art, Tech education) • Why should these departments care about PSSA results? • Right or wrong schools are evaluated on PSSA scores. • We are moving to a more interdependent school system. • Example: We hope that Social Studies collaborate with English teachers for a writing assignment on World War II!
Student Partnership • Establishing shared responsibility to student achievement is key to each student’s success. • Conferencing with each student using the previous year’s data gives encourages goal setting prior to the first benchmark. • Targeting improvement in key areas and supporting those areas in classroom review will help students understand that learning is a team venture.
Why Use Data-Driven Education • Good baseline data • Measurable instructional goals • Frequent formative assessment • Professional learning communities • Focused instructional interventions
Now that we have data, what are we going to do with it? • We had data- emetric, grow network, success for all • We had to focus on what we were doing with it • Our data process had to be cyclical • Content area results, grade level results, classroom level results- • Student results!!!!!!!- all must buy in that student needs are paramount!
Individual Plans • Each student will have an individual plan for achievement. This plan is initially based on Benchmark data. • Using individual data eliminates the discussion that occurs when students express that they did not take the Benchmark testing seriously. They begin to understand that data is the driving force in their success.
Study Island • The alignment of Study Island to the skills assessed on benchmark testing provides an opportunity for individualized instruction . • Student connection between the two programs is immediate and students assume ownership of their progress. • Assignments are based on student needs and successes are practiced to aim for advanced proficiency.
Student Individual Progress Plan • Using data from OnHand Schools, this data is directly aligned to skills assessed on Study Island. • Based on student ability , assignments are given to practice basic skills. • Based on class data, classrooms assignments will mirror general areas in need of practice. • After classroom instruction and assessment, additional work will be assigned on Study Islands.
Identified Students • Working with many identified students in General English classes, Study Island affords the opportunity to individualize all student assignments. • All Student Progress sheets look the same. The assignments differ and the number of practice sessions may differ. Students work side by side in a lab setting and all students have the same goal. • This goal is improvement in skills areas needed to be successful in a 21st Century work environment.
Classroom Instruction • The change in classroom instruction is evident in lesson plans. • Curriculum selections may not change, but the focus of the assessment will change. • With each choice of a literature selection, the choice is made based on skills needed by a particular class. • Literature selections are intentional and progress in skill areas will also be evident on Study Island data collection.
“The Man in the Water” • As evidenced by benchmark testing and Study Island, students did not appear skilled in differentiating between facts and opinions. • Reading/listening to this nonfiction selection afforded students to hear the tone of the story and to be aware of the difference between the author’s use of facts and opinions. • This coupled with prior practice of fact and opinion on Study Island provided an opportunity to assess skills on Study Island, on a text based graphic organizer and again on Study Island.
Study Island follow-up • If lessons are skill based, then Study Island affords an opportunity to remediate a skill. • Feedback is immediate and class data suggests the need to re-teach or the ability to move to the next lesson. • Since data is stored, students are able to see progress, or a need to try another avenue to receive assistance.
Goal Setting for Benchmarks • Comparison of scores for the past two years • Trends in successes and challenges • Evidence of the effect of variables in scores • Testing Schedule • Goals for scores • Plans for remediation in challenging areas • Agreement between teacher and student to accept the plan for improvement
Student Goal Setting Conferences • Prior to every benchmark test, there is one ‘quick’ goal setting meeting. • These take place in the classroom, in the computer lab, or even in the hallway. • Student and teacher agree on a score goal. • This short discussion targets specific skills and also serves as an opportunity to share ownership of student progress.
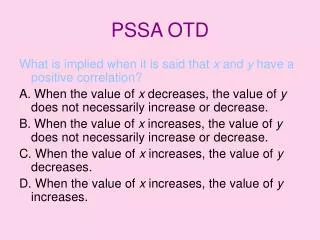
What if we do want group instruction? • Use Activotes • Question:
results • Collaboration- with teachers, with kids • Data creates consistency and understanding- between teachers, teachers and administration-parents Teachers and students! • Differentiated instruction – not just subgroups-all • Student involvement • Collective, evidence based decision-making • Breaking old paradigms- Its about the needs of the individual student – not what do I like to teach, what we always taught, …. And administration did not break them • Data based scheduling combined with advisory/mentoring
Internet Sources for Support • http://www.pde.state.pa.us/pde_internet/site/default.asp?g=0 - The PA Department of Education • http://bcs.bedfordstmartins.com/writersref6e/Player/Pages/Main.aspx - Numerous writing, grammar, and research activities and games. • http://www.pssa-prep.com/highschool_PSSA.htm - Literary Crossword Puzzles • http://www.freerice.com/ - For vocabulary preparation. • http://www.tagcrowd.com/ - Visualizes key words used in documents.
ANTICIPATION • It is exciting to wait for scores. • If scores drop, we make a plan. • If scores improve, we make a plan. • Nothing is the end of the World. • We try to improve and move forward.
Benefits other than PSSA • Great to use when scheduling • These reports may be pulled for IEP’s • Parent/Teacher Conferences • Teacher/Student Conferences • Long Term Goal Setting for Departments
What do we have to do? Just Survive!