Download
1 / 10
100 likes | 170 Vues
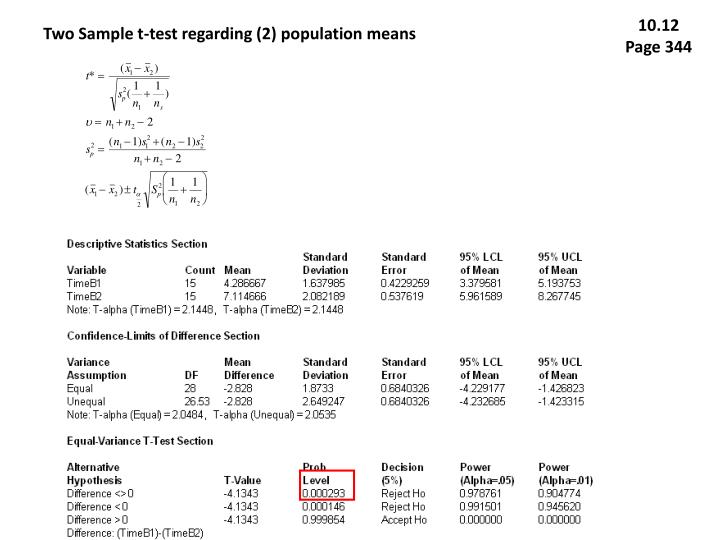
10.12 Page 344. Two Sample t-test regarding (2) population means. 10.12 Page 344. ANOVA Method. 10.12 Page 344. ANOVA Method. Think of the F distribution as the t distribution squared. All F-tests are one-tail tests. For a 2-tailed t-test, the area in the two-tails are combined.

E N D
10.12 Page 344 Two Sample t-test regarding (2) population means
10.12 Page 344 ANOVA Method
10.12 Page 344 ANOVA Method
Think of the F distribution as the t distribution squared. All F-tests are one-tail tests. For a 2-tailed t-test, the area in the two-tails are combined. All F values are positive. Notice (from the first slide) t*=-4.1343, and (-4.1343)2=17.09
11.10 Page 344 The single factor is the Ad influencing the Rating. Fcrit=F0.05,4,25=2.76 There is evidence of a difference in the mean rating of the five advertisements. n=30 observations c=5 groups j=6 observations in each group MSA MSW
mean group A mean group B SSW mean group C SSA mean group D mean group E SSA, measure of variation in means among groups SSW, measure of variation within group SST, measure of TOTAL variation
Tukey-Kramer Procedure for Comparing all Pairs If the absolute value of the mean difference in a pair is greater than the Critical Range (CR) value, the difference is significant. The CR is obtained from the Q, Studentized Range distribution, with dfnum=c and dfdenom=n-c.
One-Way ANOVA Summary Main Hypothesis F distribution test, dfnum=c-1, dfdenom=n-c • Test regarding the difference between • population means of multiple groups. • One factor of influence. • Equal variance assumption. T-K all pairs test Q distribution test, dfnum=c, dfdenom=n-c
Homework 11.13 a and b Perform the T-K procedure manually and in NCSS. If you have time, try to obtain SSA, SSW, and SST manually with the use of Excel. Be able to Compute MSA and MSW from SSA and SSW. Compute F* and Fcrit and interpret. Obtain Q Critical Range value and perform the T-K procedure to compare means of pairs.