Download
1 / 55
640 likes | 1.02k Vues
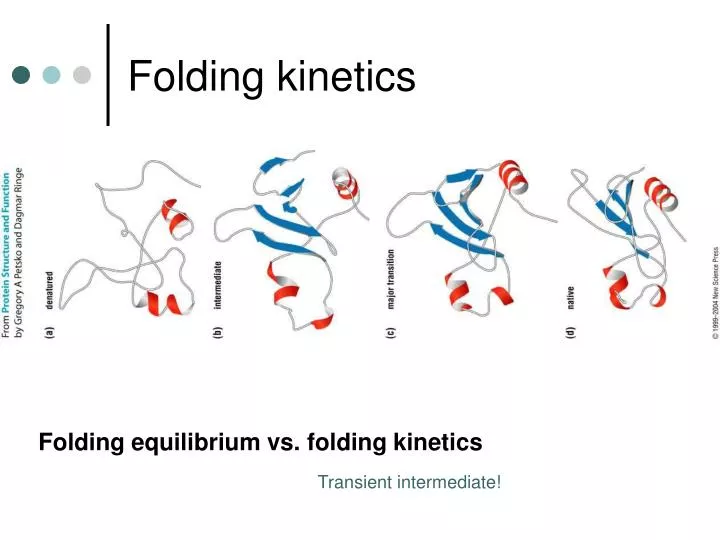
Folding kinetics. Folding equilibrium vs. folding kinetics. Transient intermediate!. R.H. Pain, Mechanisms of protein folding. Partially Folded States (Molten globule). Molten globule state :

E N D
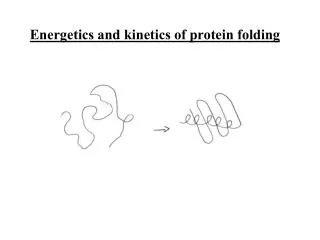
Folding kinetics Folding equilibrium vs. folding kinetics Transient intermediate!
R.H. Pain, Mechanisms of protein folding Partially Folded States(Molten globule) Molten globulestate: An intermediate conformation assumed by many globular proteins at equilibrium under mildly denaturing conditions
a-helix b-sheet Random coils Hydrophobic collapse Annealing, Assembly turns ns ms ms >S, min, hr.. Protein folding time scale • “Proteins are characterized by: • High frequency small amplitude fluctuations (10-12 – 10-9 sec) of individual side chains (NOISE!) • Large amplitude collective fluctuations of protein domains (10-6 sec) • Slower conformational transitions” Dr. Sunney Chan
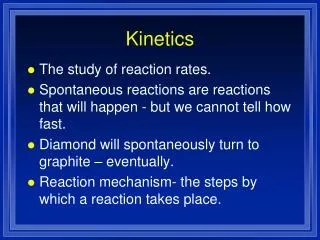
How to detect folding intermediates? • Stopped-flow designed (1970s) • Continuous-flow • Quench-flow Bieri and Kiefhber, Biol. Chem., 1999
k1 N U DGNU= -RT lnKeq = -RT ln (k1/k2) k2
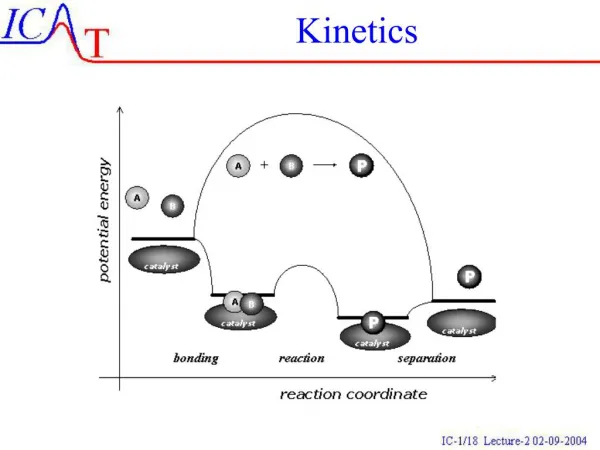
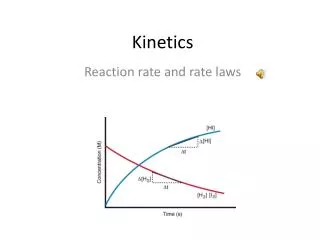
[A] = [A0] * exp (-kt) k A B Burst Phase Rate constant Amplitude k A0 • instrumental dead time • (burst phase) Kinetics of chemical reaction Start End
Refolding (UN) Unfolding (N U) Log (Rate constant) Equilibrium mid-point Denaturant Chevron Plot • DG • m k obs=Refolding rate constant + unfolding rate constant k obs=kUN*exp (-m U-TS*[urea]/RT) + kNU*exp(-m N-TS*[urea]/RT) DGUN= -RT *ln (kUN / kNU) • compactness of the transition state (TS) m U-N = m U-TS + m N-TS 0 b‡ 1
(CARD of RICK) H6 H5 H1 H4 H2 H3 H2 H1 H4 H3 Most helical bundle
Equilibrium folding Photomultiplier N 280 295 CD 1 4 3 2 U Computer Control Stepping Motor Stepping Motor Unfolding N (0 M urea) U (~4 M urea) Refolding N (~0 M urea) U (4 M urea) Stopped-flow Apparatus:Single Mixing Experiments
U signal Unfolding NU Refolding U N N signal Four Kinetic Phases are Found in Unfolding and Refolding (burst, fast, medium, slow) 3 exponential equations [A] = [A1] * exp (-k1t)+ [A2] * exp (-k2t)+ [A3] * exp (-k3t)
A B [urea] Refolding U to N Unfolding N to U 3 exponential equations [A] = [A1] * exp (-k1t)+ [A2] * exp (-k2t)+ [A3] * exp (-k3t)
1. Double jump: N U (details in unfolding) t Photomultiplier example: N U(slow) U(fast) t (details of fast forming unfolded species) 2 1 3 4 N N U 100% Computer Control %N U(cis) N(cis) U(trans) Stepping Motor Stepping Motor Delay time Sequential Mixing Experiments
1. Double jump: N U (details in unfolding) t 2. Interrupted refolding: U N (N formation in refolding) t Figure 6 (A) Fraction of native protein versus delay time in double jump experiments. The initial ( ) and final signals (·) of the signal traces were normalized to fraction folded and plotted versus delay time. (B) Fraction of native protein versus delay time in interrupted refolding experiments. The initial signal was normalized and plotted versus delay time.
Sequential folding pathway Parallel folding model
Slow folding kinetics • cis-trans isomerization • Large arrangement • Subunit assembly • Complex topology
Natively Unfolded Proteins • Natively unfolded proteins occupy a unique niche within the protein kingdom in that they lack ordered structure under conditions of neutral pH in vitro. • A lot of them became structured while binding to their binding partners
Current Opinion in Structural BiologyVolume 15, Issue 1, February 2005, Pages 35-41 Natively unfolded proteins Anthony L FinkDepartment of Chemistry and Biochemistry, University of California, Santa Cruz, CA 95064, USA It is now clear that a significant fraction of eukaryotic genomes encode proteins with substantial regions of disordered structure. In spite of the lack of structure, these proteins nevertheless are functional; many are involved in critical steps of the cell cycle and regulatory processes. In general, intrinsically disordered proteins interact with a target ligand (often DNA) and undergo a structural transition to a folded form when bound. Several features of intrinsically disordered proteins make them well suited to interacting with multiple targets and to cell regulation. New algorithms have been developed to identify disordered regions of proteins and have demonstrated their presence in cancer-associated proteins and proteins regulated by phosphorylation.
Ultra-fast foldingContinuous flow Methods 34 (2004)15-27
Chem Rev. 2006 May;106(5):1769-84. Links • Probing protein folding and conformational transitions with fluorescence. • Royer CA. • Centre de Biochimie Structurale, 29, rue de Navacelles 34090 Montpellier Cedex France.
Trp location Figure 1 (a) Structure of the regulatory domains of an activated mutant of LicT (tryptophan residues are in purple); (b) intrinsic fluorescence emission spectra of the WT and activated mutant forms
Figure 2 Intrinsic tryptophan emission of P13MTCP1 in buffer (full line) and 3 M guanidine hydrochloride (dotted line).
Figure 4 Stereoview of ribbon model overlays of the WT* form (green) and the WT NMR-derived solution #1 model (orange). The proteins exhibit the same overall fold, although the main-chain rmsd is 1.46. Major differences occur in the loop regions as well as the N-terminus of -strand 4. The side chains for residues Y47/W47, Y34, and I60 are shown Figure 3 Intrinsic emission spectra of WT protein L (circles) and the Y43W mutant (squares) under native (closed symbols) and denaturing (open symbols) conditions.
Figure 5 Ribbon representation of the 3-D structure of nuclease.29 Note that the tryptophan residue (purple) is the last residue in the sequence that exhibits order.
Trp Repressor tryptophan 19 are red, tryptophan 99 are blue. Figure 7 Steady-state spectra as a function of urea concentration for (A) trpR W99F and (B) W19F mutants. Increasing numbers correspond to increasing urea concentration. Insets: Urea unfolding profiles based on the average emission wavelength.
Figure 8 DAS (decay associated spectra) as a function of urea concentration for (A) trpR W99F and (B) W19F mutants. Increasing numbers correspond to increasing urea concentration
ANS used to probe folding intermediates Figure 9 Spectrum of ANS in the presence of beta-lactamase at (A) pH 1.7 and (B) pH 12: (1) no added salt; (2) 0.6 M salt; dotted lines correspond to the spectrum of ANS in the absence of protein.
Figure 10 Stopped-flow fluorescence of ANS and the trp repressor in a refolding experiment. IAA (indole acrylic acid)
Figure 12 Burst phase intermediate ANS intensity as a function of increasing denaturant. Figure 11 Time-dependence of ANS fluorescence from stopped-flow refolding studies of DHFR as a function of increasing acrylamide concentration (higher acrylamide concentration corresponds to lower intensities).
Figure 14 Recovered energy transfer distance distributions from the global analysis of the time-resolved decays of D-PGK and D-PGK-A. The predicted dye-to-dye distances from MD simulations (diamonds) are shown for comparison.
Figure 15 Unfolding of PGK monitored by tryptophan emission from D-PGK and D-PGK-A (circles and squares), AF emission from D-PGK-A (inverted triangles), AEDANS emission from D-PGK (triangles), and FRET efficiency from D-PGK-A (diamonds) for all six FRET pairs.
Figure 16 Stopped-flow FRET distances for the six FRET pairs of PGK. (A, 202-412; B, 135-412; C, 412-75; D, 290-412; E, 135-290; F, 75-290). Demonstrate unfolding of PGK is a multistep process and bending of the hinge between the two domain occurs.
Figure 18 FRET distance distributions at different GuHCl concentrations for doubly labeled RNase A mutants in the reduced native (Rn) and (U) unfolded states. The distances were also determined in the unfolded, oxidized state (Oxi 6M GdnHCl). Figure 17 Positions of the four inserted tryptophan residues and the seven inserted cysteine residues in the RNase A structure.
How fast can folding be Figure 19 Transient from the folding of horse apomyoglobin after a laser T-jump. The inset (B) shows the response of free tryptophan.
Designed small helical peptide labeled with extrinsic probe Figure 21 Ultrafast fluorescence intensity kinetic traces after laser T-jumps of (a) 265-275 K, (b) 273-293 K, and 303-319 K. Relaxation times obtained from fits of the data to single exponential decays were on the order of tens of nanoseconds.
Single molecule study Figure 23 Autocorrelation function and residuals of the simple diffusion model and an additional dynamics model for V60Flu FABP (Fatty acid binding protein).
FRETfluorescence resonant energy transfer thio Case in a helix bundle (B) Unmodified ACBP (sharp decrease due to FL quenching) (C) AEDANS-labeled ACBP. Ex the Trp, Em at AEDANS Large increase at first 80usec (due to major decrease of distance) following by decay phase from 10-100msec First 80us forms loosely packed and highly dynamic ensembles of states The dimension is similar to the native state
New Technology for protein folding Direct Observation of the Three-State Folding of a Single Protein Molecule Ciro Cecconi,1,2* Elizabeth A. Shank,1* Carlos Bustamante,1,2,3 Susan Marqusee UC Berkeley Science23 September 2005:Vol. 309. no. 5743, pp. 2057 - 2060 We used force-measuring optical tweezers to induce complete mechanical unfolding and refolding of individual Escherichia coli ribonuclease H (RNase H) molecules. The protein unfolds in a two-state manner and refolds through an intermediate that correlates with the transient molten globule–like intermediate observed in bulk studies. This intermediate displays unusual mechanical compliance and unfolds at substantially lower forces than the native state. In a narrow range of forces, the molecule hops between the unfolded and intermediate states in real time. Occasionally, hopping was observed to stop as the molecule crossed the folding barrier directly from the intermediate, demonstrating that the intermediate is on-pathway. These studies allow us to map the energy landscape of RNase H.
Membrane protein folding Nature438, 581-589 (1 December 2005) Solving the membrane protein folding problem
Membrane protein folding Stephen White laboratory UC Irvine General Principles of Membrane Protein Folding and Stability Constitutive Membrane Protein Assembly Inconstitutive Membrane Protein Assembly
WHY IS PROTEIN FOLDING SO DIFFICULT TO UNDERSTAND? • It's amazing that not only do proteins self-assemble -- fold -- but they do so amazingly quickly: some as fast as a millionth of a second. While this time is very fast on a person's timescale, it's remarkably long for computers to simulate. • In fact, it takes about a day to simulate a nanosecond (1/1,000,000,000 of a second). Unfortunately, proteins fold on the tens of microsecond timescale (10,000 nanoseconds). Thus, it would take 10,000 CPU days to simulate folding -- i.e. it would take 30 CPU years! That's a long time to wait for one result!
Molecular Dynamics ab initio protocol: Ignore sequence homology and attempts to predict the folded state from fundamental energetic or physicochemical properties associated with the constituents residues. (Finding a single structure of low energy) Computation secondary structure prediction based on the preference of a.a. for certain conformational states (50%) In combination of homologous sequences (70%) (computational prediction of folding is not yet reliable)
http://folding.stanford.edu/ Simulations of the villin headpiece The villin headpiece is a small, 36-residue alpha helical protein. It has been heavily studied experimentally and by simulation since is perhaps one of the smallest, fastest folding proteins. It has a hydrophobic core made of 3 phenylalanines, but also has two groups (a tryptophan and another phenylalanine) which are hydrophobic, but are solvent exposed (for functional reasons). Duan and Kollman simulated 1 microsecond of MD time, in a ground breaking simulation. However, since the folding time is on the order of 10 microseconds, it is not surprising that they did not see it fold. Our simulations contain hundred of microseconds of MD time, and we have seen 35 simulations which have folded. http://www.stanford.edu/group/pandegroup/folding/villin/index.html