1 / 0

State of the Snack Industry 2010

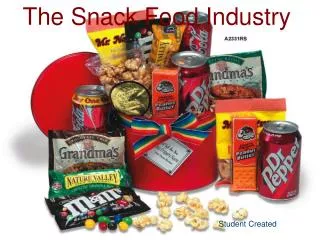
State of the Snack Industry 2010. Sally Lyons Wyatt SymphonyIRI Group. Trends Driving Market Opportunity. 1. Health and wellness evolution. 2. The search for satiation . 3. Beyond sweet and savory. 4. Green is good . 5. Back to brands (but value is key). Methodology.

ellard
Télécharger la présentation

State of the Snack Industry 2010

An Image/Link below is provided (as is) to download presentation Download Policy: Content on the Website is provided to you AS IS for your information and personal use and may not be sold / licensed / shared on other websites without getting consent from its author. Content is provided to you AS IS for your information and personal use only. Download presentation by click this link. While downloading, if for some reason you are not able to download a presentation, the publisher may have deleted the file from their server. During download, if you can't get a presentation, the file might be deleted by the publisher.

E N D

Presentation Transcript


  1. State of the Snack Industry 2010 Sally Lyons Wyatt SymphonyIRI Group
  2. Trends Driving Market Opportunity 1 Health and wellness evolution 2 The search for satiation 3 Beyond sweet and savory 4 Green is good 5 Back to brands (but value is key)
  3. Methodology Sales Performance SymphonyIRI InfoScan® Reviews SymphonyIRI MarketInsight™ SymphonyIRI Health & Wellness Advantage™ Shopping Behavior SymphonyIRI Consumer Network™ Consumer Attitudes SymphonyIRI 2011 Consumer Snacking Study
  4. Agenda 1 The Economy 2 Industry Impact 3 Key Trends 4 Opportunity 5 Conclusions
  5. The economy has made some positive strides… Source: Moody’s, February 2011
  6. …but many consumers are still struggling. A Little Worse Off 18% About the Same 45% A Lot Worse Off 20% A Lot Better 3% A Little Better 14% Personal Financial Health versus Last Year % of Consumers
  7. In the coming year, a vast majority of consumers expect the cost of living to rise… Improve Pt Chg YA (2.6) (0.1) (7.1) Consumer Perceptions of Economic and Financial Health % of Consumers
  8. …and two-thirds of consumers view their personal finances as stagnant or deteriorating. A Little Worse Off 12.7% About the Same 46.4% A Lot Worse Off 7.6% A Lot Better 6.6% A Little Better 26.7% Anticipated Change in Personal Financial Health in Coming Year % of Consumers
  9. Consumers are trimming snack spending where possible. Cutting Back on Money Spent on Snacks 42% Trying to Make Household Snacks Last Longer 30% Snacking Less Frequently 30% Eliminating Unplanned Snack Purchases 25%
  10. …and a variety of money-saving strategies are being embraced. Buying what’s on sale rather than favorite brands Paying more attention to price per serving Buying less variety 38% 26% 25%
  11. Industry volume sales have declined slightly... FDMWC Volume Sales Change 2010 v 2009
  12. …As dollar sales increased a modest 1.1%. FDMWC Dollar Sales Change 2010 v 2009
  13. Despite consumer efforts to stretch snack dollars, Walmart lost ground... Dollar Sales Change Volume Sales Change Snack Total CPG Snack Total CPG Walmart (3.1%) (4.3%) (5.2%) (5.1%) Drug 2.6% 2.6% 3.7% 3.1% Grocery 1.9% 0.0% 1.0% 0.9% Convenience 1.6% 4.1% (2.1%) 8.9% % Growth: 2010 vs 2009
  14. …and grocery gained share across two-thirds of snack categories. Grocery Gains 66% of snack categories All of the top 10 categories Share Point Change FDMWC 2010 v 2009
  15. Price fluctuations were moderate... Price Per Volume Change versus Year Ago
  16. …and were heavily influenced by promotional activity. Change in Average Price Per Volume Pt Chg Volume w/ Merch. Support (1.9) 0.0 (1.4) (1.2) +0.1 +0.6 +1.0 +2.6 +2.2 +0.3 +5.7
  17. Five key trends are influencing market opportunity and growth. Health & Wellness Evolution Search for Satiation Beyond Sweet & Savory Green is Good Back to Brands.. But Value is Key
  18. Consumers are on a journey for healthier eating. 71% of consumers are trying to eat healthier
  19. …Resulting in noteworthyshare shifts over a multi-year period. 2010 +7 Points -7 Points 2006 Share of Dollar Sales- FDMx 2010 v 2006
  20. While both healthier and indulgent snack segments are growing... Healthier Indulgent 4.9% 4.4% 1.2% 1.0% Dollars Volume Dollars Volume Volume Sales Growth % Change versus Year Ago
  21. …Healthier snacks are outpacing indulgent options… Nutritional Snacks/Trail Mixes Yogurt Snack Nuts Snack/Granola Bars Salsa +9.8% +8.1% +7.6% +7.4% +6.7% Total Healthier +4.4% Prepared Pudding Chocolate Covered Salted Snacks Dried Meat Snacks Rfg Appetizers/Snack Rolls Chocolate Candy +13.7% +13.5% +10.0% +8.9% +4.7% Total Indulgent +1.2% FDMx $ Growth 2011 v 2010
  22. …Driven, in part, by better-for-you innovation. Fat Free 100 Calories 100% Natural Whole Grain Sugar Free
  23. Snacks play an important role in providing satiation. Perception of the Role of Snacks % of Consumers
  24. In part due to underlying H&W and satiation trends, strong growth is evident outside sweet & savory. Sweet Savory Other Meat Snacks Dry Dip Mixes Snack Nuts/Sds Rfg Dips Salty Snacks Total Pudding Gelatin Chocolate Candy Fz Novelties Fz Yogurt Total +12% +7% +5% +3% +2% +0.3% Rfg Apps/Snk Rolls Snack/Granola Bars Yogurt Dry Fruit Snacks String Cheese Total +8% +7% +6% +5% +3% +4% +8% +6% +6% +3% +0.4% +0.7% Sweet & Savory Carob/Yogurt Coated Snacks Chocolate Covered Salty Snacks +6% +16% % Dollar Sales Growth 2010 v 2009
  25. Snacks touting high protein and low sodium attributes are demonstrating particularly strong growth. Dollar Sales Growth % Change versus Year Ago
  26. …And a number of new products boasting these attributes made in-roads in the past year.
  27. Still, many consumers view snacks as a time for pure pleasure… 32% 60% 55% of consumers Are more likely to eat what tastes good rather than what is healthier 55% of consumers Often eat snacks for enjoyment, not hunger
  28. …A “me time” that satisfies simple indulgences. Satisfy a Specific Craving Fun & Indulgence Enjoy Bold & Exciting Flavors Perception of the Role of Snacks % of Consumers
  29. Snack marketers are successfully bringing indulgences to market across a number of snack categories.
  30. Natural and organic snacks are performing well. Dollar Sales Growth FDMxC
  31. …And will likely continue to gain momentum. 29% of consumers it is important that snacks are natural/organic 20% of consumers are trying to increase consumption of natural/organic foods
  32. Sustainability remains a growth opportunity. Factors Influential in Snack Selection % of Consumers
  33. Efforts in this area should be well-communicated.
  34. Value remains an essential snack consideration. 76% of consumers actively look for the best value when buying snacks
  35. Brand decisions are heavily influenced by price… 44% of consumers Brand decisions are very strongly influenced by item price
  36. …And the desire for effective everyday pricing is intensifying. % of consumers seeking their favorite brands… 2009 2011 +7 Points …at a Reasonable Regular Price 20% 27% …on Sale 44% 41%
  37. Preplanning has become a common money-saving strategy. Where Purchase Decisions Are Made % of Shoppers
  38. List-making is quite prevalent. 44%use a store flyerto make the list 52%list categories to buy 38%use coupons to create the list 67% of consumers 14%list specific brandsto buy work from a pre-made list List- Making Rituals % of List- Making
  39. Store choice is based equally on price and convenience… Conveniently Located Lowest Every Day Prices Best Selection of Products Able to Get In/Out of Store Quickly Selection of Private Label One-Stop Shopping 56% 53% 43% 40% 29% 27% Key Store Selection Considerations % of Shoppers
  40. …And consumers are culling information from a variety of sources. Influencers of Brand Decisions % of Shoppers Indicating Very Strongly Influenced
  41. Brand experiences are also essential. 46% of consumers Brand decisions are very strongly influenced by brand trust
  42. Despite a difficult economy, consumers show growing affinity for favorite brands. +4 Points Brand Preference % of Consumers
  43. Still, a noteworthy share of consumers will purchase any brand, if the price is right. Any brand with the lowest available price per serving Any brand at the lowest available price point 12% 20% Any Brand 32%
  44. Store brands are viewed as a viable option, particularly in tight financial times. 47% of consumers switch to store brands when the budget is tight
  45. Store brands hold a respectable share of snack volume, but share slid slightly in the past year. -0.4 Points Private Label Share of Snack Sales: FDMx
  46. Innovation played a key role in protecting and growing share across several snack categories… Number of New Product Pacesetters Most Active Snack Categories: 2010 Private Label Share Point Change vs Year Ago, FDMx
  47. …and driving growth despite a conservative consumer environment.
  48. For many, snacks play an important role in achieving nutritional goals. 60% of consumers are trying to eat foods that help prevent health problems and/or manage existing health conditions 40% of consumers view snacks as an important part of a healthy eating plan throughout the day 24% of consumers seek snacks that offer benefits beyond basic nutrition
  49. Communicate a broad range of wellness-related attributes … Those “tried & true”… …And those emerging! 45% Low Fat Low Cholesterol Low Sugar High Fiber Low Calorie Whole Grains Low Salt/Sodium All Natural/Natural Ingredients 50% 47% 39% 47% 46% 45% 44% Important Product Attributes % of Consumers
  50. …across marketing vehicles… Be sure to reach into the home!
  51. …across marketing vehicles… Be sure to reach into the home!
  52. Carry that message over into the store… 51% of consumers want retailers to clearly identify healthier products in the store
  53. …and onto product packaging. All Natural 47% of consumers want comments or symbols on packages to help easily pick out healthier options Sugar-Free
  54. Be on the lookout for “the next big thing!” U.S. Retail Sales of Gluten-Free Products $ Billions Source: Packaged Facts, “2011 Gluten Free Foods & Beverages Report”
  55. Partner with parents as they work to teach their children about healthy eating. 35% Offer snacks with nutrients Watch portion sizes Offer snacks that are fresh/not processed Offer low fat snacks Offer low calorie snacks 70% of parents 67% 58% view snacks as an opportunity to teach kids about healthy eating 56% 51% Parental Strategies for Kids’ Snacks % of Consumers
  56. Reinforce the notion of balancebetweenprice and nutritional value. 71% 43% of parents of parents will compromise on nutritional value to save money look for snacks that are inexpensive
  57. Role of snack heavily impacts snack selection... Primary Objective of Snack Selection- by Snack Type % of Consumers
  58. …And must be reflected in messaging. Hunger Satisfaction as Objective of Snack Selection- by Snack Type % of Consumers
  59. Communicate snack roles...everywhere.
  60. Communicate snack roles...everywhere.
  61. Snacks are playing an important role in at-home entertaining and socialization... 39% of consumers entertain family & friends at home instead of going out
  62. …Igniting new snack opportunities. 54% of consumers snack more during social occasions 57% of consumers consider snacks an important part of social occasions
  63. Tailor messages to key snack rituals, such as family time/at-home entertainment...
  64. …and on-the-go from-home eating. 34% of consumers eat snacks instead of a meal on the go 39% of consumers seek snacks that can be eaten on the go
  65. Create a bigger impact on shoppers in the home. 26% of consumers plan specific snacks before going to the store
  66. Dig deep with new mediaefforts designed to build excitement and buzz.
  67. Dig deep with new mediaefforts designed to build excitement and buzz.
  68. Empower consumers with old and new media tools that reinforce the notion of value and price. Clip and save! AND Click and save!
  69. Continue to highlight value and money-saving opportunities. 35% of consumers stock up on certain items when they are on sale.
  70. Build baskets with cross promotion and cross merchandising…
  71. Build growth by addressing opportunities and risks arising from emerging trends. Beyond Sweet & Savory H&W Satiation Green Brands/ Value Part of healthy eating plans Messaging around hunger satisfaction Handheld Packaging & Practices Reduced PL threat Portable Educating kids Effective pricing make or break Communication Hearty Affordable nutrition Tap into new snack rituals In-store signs Packaging Indulgent innovation
  72. THANK YOU! For more information: Sally Lyons Wyatt SymphonyIRI Group Sally.LyonsWyatt@SymphonyIRI.com
  73. Appendix: Healthier & Indulgent Categories Carob/Yogurt Covered Snacks Cheese (String & Cubes) Dried Fruit Dry Fruit Snacks Light Ice Cream/Sherbet/ Fz Novelties Light Salty Snacks Multigrain Salty Snacks Popcorn (Non-Sweet) Pretzels Reduced Fat Cookies Reduced Fat Crackers Rice/Popcorn Snacks Salsa & Picante Snack/Granola Bars Snack Nuts/Seeds Sugarless Gum Trail Mixes Yogurt/ Frozen Yogurt Healthier Aerosol Cheese Bakery Snacks & Desserts Chocolate Candy Chocolate Covered Salty Snacks Dips Fz& Rfg Appetizers/ Handheld Entrees Regular Ice Cream/Fz Novelties Meat Snacks Non-Chocolate Candy Pastry/Doughnuts Popcorn (Sweet) Pudding/Gelatin Regular Fat Cookies Regular Fat Crackers Regular Fat Salty Snacks Regular Gum Toaster Pastries Indulgent
  74. Appendix: Healthier & Indulgent Categories Carob/Yogurt Covered Snacks Cheese (String & Cubes) Dried Fruit Dry Fruit Snacks Light Ice Cream/Sherbet/ Fz Novelties Light Salty Snacks Multigrain Salty Snacks Popcorn (Non-Sweet) Pretzels Reduced Fat Cookies Reduced Fat Crackers Rice/Popcorn Snacks Salsa & Picante Snack/Granola Bars Snack Nuts/Seeds Sugarless Gum Trail Mixes Yogurt/ Frozen Yogurt Healthier Aerosol Cheese Bakery Snacks & Desserts Chocolate Candy Chocolate Covered Salty Snacks Dips Fz& Rfg Appetizers/ Handheld Entrees Regular Ice Cream/Fz Novelties Meat Snacks Non-Chocolate Candy Pastry/Doughnuts Popcorn (Sweet) Pudding/Gelatin Regular Fat Cookies Regular Fat Crackers Regular Fat Salty Snacks Regular Gum Toaster Pastries Indulgent
More Related