Download
1 / 30
300 likes | 458 Vues
Population, the environment (and biodiversity loss as an indicator). David Lindenmayer Fenner School of Environment and Society. Impact of the human population (Ehrlich & Holdren). I = P x A x T where: I = Impact P = absolute size of population

E N D
Population, the environment (and biodiversity loss as an indicator) David Lindenmayer Fenner School of Environment and Society
Impact of the human population (Ehrlich & Holdren) I = P x A x T where: I = Impact P = absolute size of population A = per capita consumption (affluence) T = environmental damage in supplying each unit of consumption
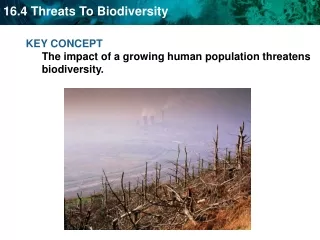
IPAT revisited We lack a variable that captures ecosystem condition (e.g. biodiversity loss) Escalating impacts of resource extraction and consumption – on ecosystems & biodiversity (“T” is increasing)
Supercharged IPAT (Davidson & Andrews, 2013) Much harder to extract resources than before Concentration of ore bodies and other resources declining dramatically (G. Mudd 2013) Barrel of oil extracted now >> impact cf 1950s Even if popn or consumption constant, ecological impact of resource extraction can increase
More than IPAT now Water and GHG costs of extraction and treatment/processing is large and increasing (e.g. 13 900 tonnes of Co2 for each tonne of gold) (25kg of Co2 for each tonne of bauxite) (G. Mudd, 2013) Several BILLION tonnes of waste rock and tailings every year (G. Mudd, 2013)
>22 million people – > 93% urbanised High population growth rate Massive resource use (to support SOL) High per capita energy consumption High environmental impact (biodiversity loss) The human dimension
The human dimension • Australia’s population by 2050 = 30-40+ million?? • Another 90 cities the size of Canberra or Sydney and Melbourne as mega-cities of 8-10 million • (Foran & Poldy 2002)
Much urban expansion is into woodlands and grasslands that are nationally endangered ecosystems
Data for all species in Australia Correlation between human population density and species richness (Luck et al. 2004) Percentage of threatened species in each group Percentage of range-restricted species in each group
But (perhaps) ironically……. Northern Australia is likely to be where we can make the most cost-effective environmental and conservation gains
The “cost of each person” in Australia 200 tonnes of natural resources per year (cf 60 in USA cf 30 in Japan (Foran et al. 2002) 24 tonnes of Co2 per capita per year (twice OECD average, 4X world average)
The “cost of each person” in Australia Each additional resident costs $340K wrt extra built assets required $220 billion for extra 600 000 people in western Sydney alone in next 20 years Other costs = impacts on environment & diverted resources from addressing environmental problems
Other “costs” of Australian population ??Feeding the rest of the world BUT depleting the nation’s environmental infrastructure (i.e. the ecosystems that provide food and fiber)
How will we feed the extra people?(Australia to feed the world?)
Agricultural intensification is NOT possible in some Australian ecosystems
But there are significant issues with over-clearing – especially wrt biodiversity loss
Northern Australia – not the food bowl of Asia • Land capability mapping and assessment dating back to the 1960s from CSIRO (LUR) • Limited capability for agriculture over vast parts of Northern Australia • Large parts of the continent will become degraded with intensification = “Morocco” potential
The human population HAS large impacts on the environment – with the status of biodiversity a crude indicator of impact – even if its impact is offset (and is somewhere else = e.g. NZ) The human dimension
AUSTRALIA the population, environmental, and education paradox?
One of the richest nations biologically in the world One of the most environmentally degraded nations in the world A well educated population – but not well educated in population issues, long-term ecological sustainability and biodiversity conservation (as an indicator of sustainability)
The need for “real” debate • Population growth ≠ economic wealth • Population growth needs to be discussed as a major issue – separated from racist and religious debates (SEWPAC) • Relationship between population size, levels of consumption, land degradation and biodiversity loss MUST be discussed