Download
1 / 1
10 likes | 154 Vues
Potentially incapacitating IRIS (B). THPE0181. At least moderate nutritional risk. Low or no nutritional risk. Platelets. Predictive value of stage-specific risk factors for Immune Reconstitution Inflammatory Syndrome. Erythrocyte sedimentation rate. Lymphoid depletion, 1 (3.7%).

E N D
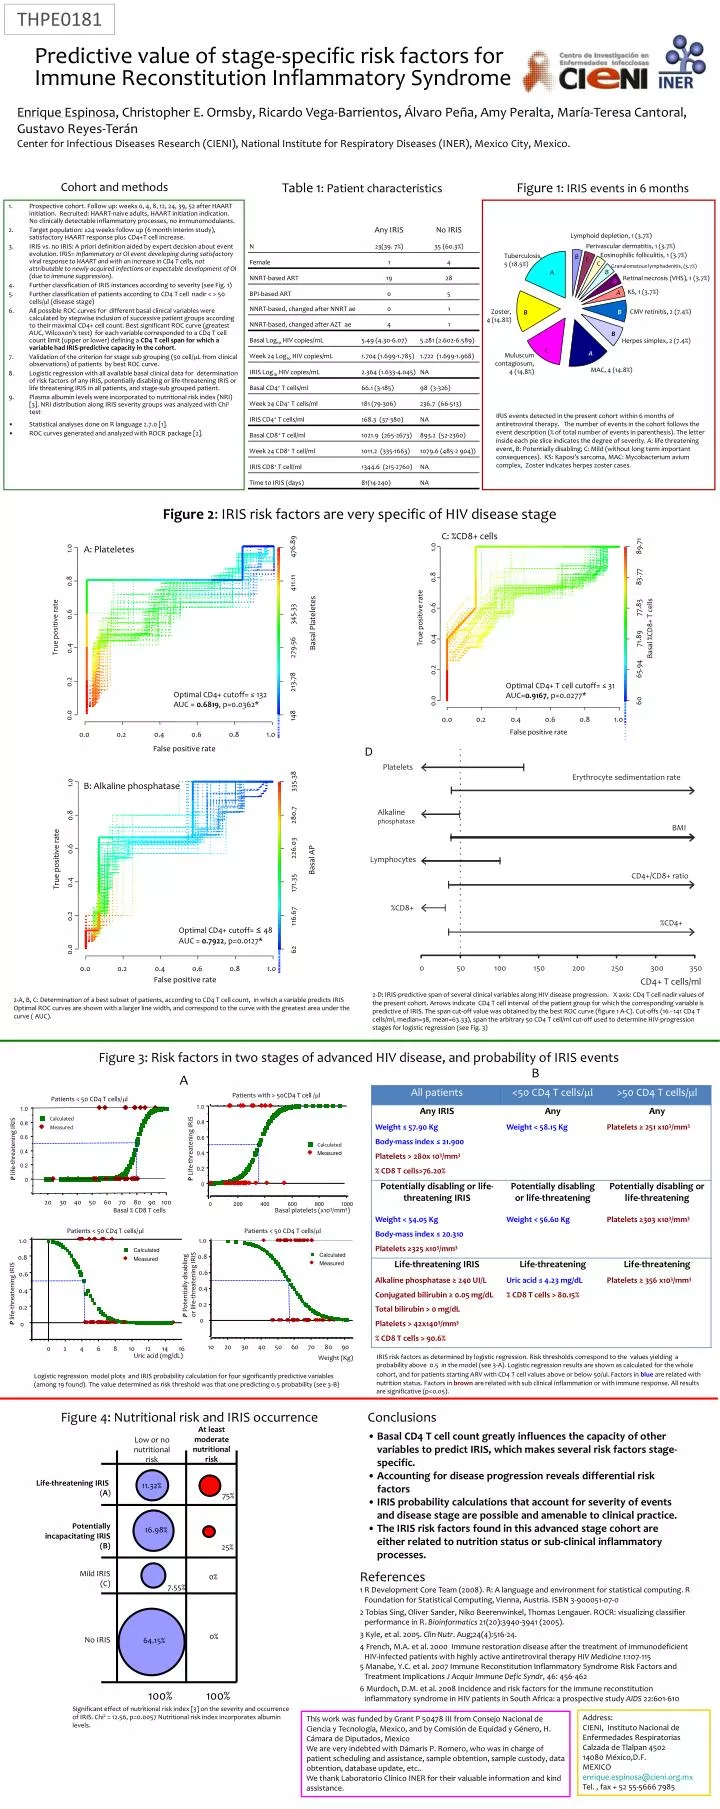
Potentially incapacitating IRIS (B) THPE0181 At least moderate nutritional risk Low or no nutritional risk Platelets Predictive value of stage-specific risk factors for Immune Reconstitution Inflammatory Syndrome Erythrocyte sedimentation rate Lymphoid depletion, 1 (3.7%) Perivascular dermatitis, 1 (3.7%) Life-threatening IRIS (A) Alkaline phosphatase 11.32% Enrique Espinosa, Christopher E. Ormsby, Ricardo Vega-Barrientos, Álvaro Peña, Amy Peralta, María-Teresa Cantoral, Gustavo Reyes-Terán Center for Infectious Diseases Research (CIENI), National Institute for Respiratory Diseases (INER), Mexico City, Mexico. B Eosinophilic folliculitis, 1 (3.7%) Tuberculosis, 5 (18.5%) C 75% BMI C Patients < 50 CD4 T cells/ml A Granulomatous lymphadenitis, (3.7%) 1.0 B Calculated 0.8 Retinal necrosis (VHS), 1 (3.7%) B Measured Lymphocytes 16.98% 0.6 P Potentially disabling or life-threatening IRIS Cohort and methods Table 1: Patient characteristics Figure 1: IRIS events in 6 months CD4+/CD8+ ratio A 0.4 KS, 1 (3.7%) 25% 0.2 • Prospective cohort. Follow up: weeks 0, 4, 8, 12, 24, 39, 52 after HAART initiation. Recruited: HAART-naive adults, HAART initiation indication. No clinically detectable inflammatory processes, no immunomodulants. • Target population: ≥24 weeks follow up (6 month interim study), satisfactory HAART response plus CD4+T cell increase. • IRIS vs. no IRIS: A priori definition aided by expert decision about event evolution. IRIS= Inflammatory or OI event developing during satisfactory viral response to HAART and with an increase in CD4 T cells, not attributable to newly acquired infections or expectable development of OI (due to immune suppression). • Further classification of IRIS instances according to severity (see Fig. 1) • Further classification of patients according to CD4 T cell nadir < > 50 cells/ml (disease stage) • All possible ROC curves for different basal clinical variables were calculated by stepwise inclusion of successive patient groups according to their maximal CD4+ cell count. Best significant ROC curve (greatest AUC, Wilcoxon’s test) for each variable corresponded to a CD4 T cell count limit (upper or lower) defining a CD4 T cell span for which a variable had IRIS-predictive capacity in the cohort. • Validation of the criterion for stage sub grouping (50 cell/mL from clinical observations) of patients by best ROC curve. • Logistic regression with all available basal clinical data for determination of risk factors of any IRIS, potentially disabling or life-threatening IRIS or life threatening IRIS in all patients, and stage-sub grouped patient. • Plasma albumin levels were incorporated to nutritional risk index (NRI) [3]. NRI distribution along IRIS severity groups was analyzed with Chi2 test. • Statistical analyses done on R language 2.7.0 [1]. • ROC curves generated and analyzed with ROCRpackage [2]. 0 B B %CD8+ Zoster, 4 (14.8%) CMV retinitis, 2 (7.4%) Mild IRIS (C) 0% %CD4+ 10 20 30 40 50 60 70 80 90 7.55% Weight (Kg) A B Herpes simplex, 2 (7.4%) 0 50 100 150 200 250 300 350 C B A 0% Muluscum contagiosum, 4 (14.8%) CD4+ T cells/ml No IRIS 64.15% B A MAC, 4 (14.8%) 100% 100% IRIS events detected in the present cohort within 6 months of antiretroviral therapy. The number of events in the cohort follows the event description (% of total number of events in parenthesis). The letter inside each pie slice indicates the degree of severity. A: life threatening event, B: Potentially disabling; C: Mild (without long term important consequences). KS: Kaposi’s sarcoma, MAC: Mycobacterium avium complex, Zoster indicates herpes zoster cases. Figure 2: IRIS risk factors are very specific of HIV disease stage C: %CD8+ cells 89.71 476.89 1.0 A: Plateletes 1.0 83.77 0.8 0.8 411.11 77.83 0.6 345.33 0.6 True positive rate Basal Plateletes True positive rate Basal %CD8+ T cells 71.89 0.4 279.56 0.4 65.94 0.2 213.78 0.2 Optimal CD4+ T cell cutoff= ≤ 31 AUC=0.9167, p=0.0277* Optimal CD4+ cutoff= ≤132 AUC = 0.6819, p=0.0362* 60 0.0 0.0 148 0.0 0.2 0.4 0.6 0.8 1.0 False positive rate 0.0 0.2 0.4 0.6 0.8 1.0 D False positive rate 335.38 1.0 B: Alkaline phosphatase 280.7 0.8 226.03 0.6 True positive rate Basal AP 0.4 171.35 116.67 0.2 Optimal CD4+ cutoff= ≤ 48 AUC = 0.7922, p=0.0127* 0.0 62 0.0 0.2 0.4 0.6 0.8 1.0 False positive rate 2-D: IRIS-predictive span of several clinical variables along HIV disease progression. X axis: CD4 T cell nadir values of the present cohort. Arrows indicate CD4 T cell interval of the patient group for which the corresponding variable is predictive of IRIS. The span cut-off value was obtained by the best ROC curve (figure 1 A-C). Cut-offs (16 - 141 CD4 T cells/ml, median=38, mean=63.33), span the arbitrary 50 CD4 T cell/ml cut-off used to determine HIV-progression stages for logistic regression (see Fig. 3) 2-A, B, C: Determination of a best subset of patients, according to CD4 T cell count, in which a variable predicts IRIS Optimal ROC curves are shown with a larger line width, and correspond to the curve with the greatest area under the curve ( AUC). Figure 3: Risk factors in two stages of advanced HIV disease, and probability of IRIS events B A Patients with > 50CD4 T cell /ml Patients < 50 CD4 T cells/ml 1.0 1.0 Calculated 0.8 0.8 Measured 0.6 0.6 Calculated P Life-threatening IRIS P life-threatening IRIS 0.4 Measured 0.4 0.2 0.2 0 0 20 30 40 50 60 70 80 90 100 0 200 400 600 800 1000 Basal % CD8 T cells Basal platelets (x103/mm3) Patients < 50 CD4 T cells/ml 1.0 Calculated 0.8 Measured 0.6 0.4 P life-threatening IRIS 0.2 0 0 2 4 6 8 10 12 14 16 IRIS risk factors as determined by logistic regression. Risk thresholds correspond to the values yielding a probability above 0.5 in the model (see 3-A). Logistic regression results are shown as calculated for the whole cohort, and for patients starting ARV with CD4 T cell values above or below 50/ul. Factors in blueare related with nutrition status. Factors in brown are related with sub clinical inflammation or with immune response. All results are significative (p<0.05). Uric acid (mg/dL) Logistic regression model plots and IRIS probability calculation for four significantly predictive variables (among 19 found). The value determined as risk threshold was that one predicting 0.5 probability (see 3-B) Figure 4: Nutritional risk and IRIS occurrence • Conclusions • Basal CD4 T cell count greatly influences the capacity of other variables to predict IRIS, which makes several risk factors stage-specific. • Accounting for disease progression reveals differential risk factors • IRIS probability calculations that account for severity of events and disease stage are possible and amenable to clinical practice. • The IRIS risk factors found in this advanced stage cohort are either related to nutrition status or sub-clinical inflammatory processes. References 1 R Development Core Team (2008). R: A language and environment for statistical computing. R Foundation for Statistical Computing, Vienna, Austria. ISBN 3-900051-07-0 2 Tobias Sing, Oliver Sander, Niko Beerenwinkel, Thomas Lengauer. ROCR: visualizing classifier performance in R. Bioinformatics 21(20):3940-3941 (2005). 3 Kyle, et al. 2005. Clin Nutr. Aug;24(4):516-24. 4 French, M.A. et al. 2000 Immune restoration disease after the treatment of immunodeficient HIV-infected patients with highly active antiretroviral therapy HIV Medicine 1:107-115 5 Manabe, Y.C. et al. 2007 Immune Reconstitution Inflammatory Syndrome Risk Factors and Treatment Implications J Acquir Immune Defic Syndr, 46: 456-462 6 Murdoch, D.M. et al. 2008 Incidence and risk factors for the immune reconstitution inflammatory syndrome in HIV patients in South Africa: a prospective study AIDS 22:601-610 Significant effect of nutritional risk index [3] on the severity and occurrence of IRIS. Chi2 = 12.56, p=0.0057 Nutritional risk index incorporates albumin levels. Address: CIENI, Instituto Nacional de Enfermedades Respiratorias Calzada de Tlalpan 4502 14080 México,D.F. MEXICO enrique.espinosa@cieni.org.mx Tel. , fax + 52 55-5666 7985 This work was funded by Grant P 50478 III from Consejo Nacional de Ciencia y Tecnología, Mexico, and by Comisión de Equidad y Género, H. Cámara de Diputados, Mexico We are very indebted with Dámaris P. Romero, who was in charge of patient scheduling and assistance, sample obtention, sample custody, data obtention, database update, etc.. We thank Laboratorio Clínico INER for their valuable information and kind assistance.