1 / 0

Lupin Scaling new heights …. May 8, 2013

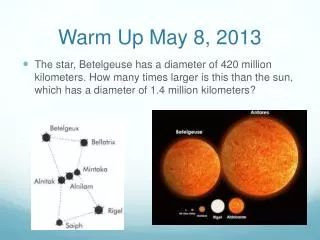
Lupin Scaling new heights …. May 8, 2013. Safe Harbor Statement.

ellis
Télécharger la présentation

Lupin Scaling new heights …. May 8, 2013

An Image/Link below is provided (as is) to download presentation Download Policy: Content on the Website is provided to you AS IS for your information and personal use and may not be sold / licensed / shared on other websites without getting consent from its author. Content is provided to you AS IS for your information and personal use only. Download presentation by click this link. While downloading, if for some reason you are not able to download a presentation, the publisher may have deleted the file from their server. During download, if you can't get a presentation, the file might be deleted by the publisher.

E N D

Presentation Transcript


  1. LupinScaling new heights….May 8, 2013

  2. Safe Harbor Statement Materials and information provided during this presentation may contain ‘forward-looking statements’. These statements are based on current expectations, forecasts and assumptions that are subject to risks and uncertainties which could cause actual outcomes and results to differ materially from these statements. Risks and uncertainties include general industry and market conditions, and general domestic and international economic conditions such as interest rate and currency exchange fluctuations. Risks and uncertainties particularly apply with respect to product-related forward-looking statements. Product risks and uncertainties include, but are not limited, to technological advances and patents attained by competitors, challenges inherent in new product development, including completion of clinical trials; claims and concerns about product safety and efficacy; obtaining regulatory approvals; domestic and foreign healthcare reforms; trends toward managed care and healthcare cost containment, and governmental laws and regulations affecting domestic and foreign operations. Also, for products that are approved, there are manufacturing and marketing risks and uncertainties, which include, but are not limited, to inability to build production capacity to meet demand, unavailability of raw materials, and failure to gain market acceptance. The Company disclaims any intention or obligation to update or revise any forward-looking statements whether as a result of new information, future events or otherwise.
  3. Vision: To be an innovation led transnational pharmaceutical company
  4. Pharma Landscape
  5. Global generics to grow from $242b to $400b in 2016 France : 41 6 8 Germany : 45 710 UK : 22 57 USA : 322 4778 Canada: 22 67 China : 67 31 58 India : 14 13 27 Italy : 29 3.5 4.5 Spain : 23 2 3 Japan: 111 6 10 2011 Total Mkt Brazil : 30 15 28 Mexico : 10 48 2011 Gx 2016 Gx Australia : 13 1.5 2.5 Source; IMS market prognosis, May 2012 Generic Mkt 2011- $242 b Generic Mkt 2016- $400 b Overall growth: 65% CAGR: 11% PharmaMkt 2011- $956 b PharmaMkt 2016 - $ 1145 – 1235b
  6. BRIC – Fuelling generics & overall growth Rapid growth in generics driven by : Economic growth Healthcareexpenditure New products Structural changes in healthcare systems Source; IMS Health, Epsicom & Bloomberg
  7. Industry Trends & Drivers Headwinds Tailwinds Generics are the obvious winners of any healthcare reform (affordable care) Price control measures & inclination of moving branded generics to generic – generic (e.g. India, EU5) Potential opportunities in the bio-similars space (regulatory pathway evolving across markets) Patent cliff - ~$60b of drugs going off patent in 5 years (2014 to 2018), as against ~$70b in 3 years (2011 to 2013) Big Pharma pursuing BGxopportunities Industry under consolidation phase (lesser number of competitors). Partnering opportunities Increasing regulatory costs & oversight Ageing population
  8. Momentum gained so far…
  9. Lupin Today 8th largest Market Cap amongst Global Generic Companies ~$5.7 billion Revenues > $ 1.74 billion Top 4 Pharmaceutical company in India US and Domestic business outperforming industry Onshore presence in 10 countries (significant presence across 4 countries) R&D expenditure @ 7.5% of net sales Vertically integrated 12 manufacturing sites (5 US FDA approved) (2 sites in Japan) Conversion rate: USD = INR 54.30
  10. Awards & Accolades NDTV Business Leadership Awards - PharmaCompany of the Year 2012 Lupin was ranked 1st amongst pharma companies in the Great Place to Work survey ‘Best Companies to work for 2012, India’ and amongst the Top 50 companies overall NSE included Lupin in the S&P CNX NIFTY index Ernst & Young Entrepreneur of the Year 2011, for Life Sciences and Health Care: Dr DeshBandhuGupta Ernst & Young Family Business Award 2012: Ms. Vinita Gupta CVS Caremark Supplier Partner Award winner - Pharmacy Category for 2012
  11. Evolved into a multinational company with >70 % of turnover from outside India 4th largest pharma company in India 5th largest and fastest growing generic player in the US by prescriptions 7th largest and the fastest growing generic player in Japan Consistent track record of growth Net Sales - CAGR 27% EBITDA - CAGR 29% Figures in USDm
  12. Profit & shareholder returns Net profit -CAGR 26% Figures in USDm
  13. Corporate Highlights FY13 423 1,742 242 58% Net sales grew by 36% to USD 1,742 m during FY13 EBITDA margins grew to 24% during FY13 from 21% Growth across all geographies US business (including IP) grew by 49% India Region Formulation sales grew at 24% Japan grew by 52% and South Africa grew by 26% 36% 52% 1,282 269 160 Continued investment for growth Capital expenditure at USD 90m. R&D revenue expenditure 7.5% of net sales at USD 131m Filed 21 ANDAs
  14. Consistent execution leading to QoQ & YoY growth Net Sales (USDm) PAT (USDm) EBITDA %
  15. Business Mix – FY13 Geographical breakup US sales split Major markets (Net sales) Sales break up
  16. Key financial indicators Profitability / Returns Financial ratios
  17. Geography wise performance
  18. United States Net sales (USDm) 694 Brand business grew by13% while generics grew by 70% Brands business ~21% of the US sales US business clocked USD 693 m Received approval for Suprax drops 14 ANDA approvals received & 10 products launched during the year Strong base business #1 in 24 out of 46 products (IMS Mar’13) Top 3 in 37 out of 46 products (IMS Mar’13) 5th largest generics player (IMS Dec’12) Challenges Generic challenge for Antara Strong Pipeline 116 pipeline products (market $ 54 b) 25 first to file generics, (market ~$13 b) 12 exclusives (market ~$1.62 b)
  19. India Net sales (USDm) Ranked 7thon Month MAT Jan’13 basis. Chronic & Semi-Chronic therapies now constitute 60% of the portfolio Gluconormand Tonact contributed above Rs.1,000m in sale Ranked 3rdin CVS segment as per growth rate. CNS/Neurosegment grew 19.1% against market growth of 12.6% Ranked 7thin Anti Diabetics segment with growth of 23.1% Retained its top position with 44.6% market share in Anti TB segment 435 24% 351
  20. India Chronic & Semi-chronic therapies now account for 60% of the portfolio
  21. Japan Net sales (USDm) Completed 5 years in the Japanese market Sales increased from USD 86million to USD 240 million during 5 years In JPY terms consolidated net sales increased to JPY 19,785 m, entailing a YoY growth of 39% Kyowa excluding Irom grew by 14% to JPY 13,984m Supply chain integration from India: Goa facility received first 3 approvals in formulations Tarapur facility received 2 approvals in API 11 products launched during the year 240 159
  22. ROW sales Pharma Dynamics emerged as the 5th largest generic company in South Africa and the no.1 CVS company during FY13. Launched OTC products in Australia under the umbrella of “Pharmacy Action” Multicare amongst the fastest growing generic companies in the Philippines, improving its ranking from 39 to 34 last year Largest supplier of Anti-TB products to WHO Net sales (USDm) 154 113
  23. API Net sales (USDm) 694 Strategic input into formulations business #1 TB and Ceph player globally API business grew by 12% from USD 466 m. to USD 694 m in FY13 Increasing focus on US API 466
  24. R&D 131 R&D spends (USDm) Total expenditure at 7.5% of sales Talent pool of 1200+ scientists 176 ANDA filings, of which 78 have been approved by the U.S. FDA &138 US DMFs filed to date Filed 21 ANDAs & received 14 approvals during the year Increased focus on F2F (25 filings in pipeline) NDDD: Pipeline of 10 programs in various phases of drug discovery Bio-similars: Approval received for GCSF (Filgrastim) Pipeline of 10 drugs in various phases of development
  25. Future direction
  26. Growth Levers & Enablers Healthy pipeline Value added generics Specialties NDDR program Geographical expansion Brands Platform technologies Disruptive costs Supply chain efficiency Leadership pipeline & capability building Sustainability initiatives (people, planet & profitability)
  27. Thank You

More Related