Download
1 / 18
180 likes | 184 Vues
This study focuses on developing a model using Artificial Neural Networks (ANN) to simulate extreme lake level variations. The ANN model is compared with Autoregressive (AR) and Multiple Linear Regression (MLR) models to evaluate its performance.

E N D
ARTIFICIAL NEURAL NETWORKS FOR LAKE LEVEL MODELLING Ozgur Kisi Erciyes University, Engineering Faculty, Civil Eng. Dept., Kayseri, Turkey, E.mail: kisi@erciyes.edu.tr Taner Cengiz, Fatih Unes Istanbul Technical University, Civil Engineering Faculty, Civil Eng. Dept., Istanbul, Turkey
It is necessary to develop models for simulation of the extreme or abnormal level variations in order to control future level changes_in_a_lake. Level measurements or their future equally likely replicas obtained through a simulation model are a direct way of obtaining_lake_management_decision_variable.Although it is possible to identify sophisticated models taking into consideration the hydrological and hydro meteorological variables such as the precipitation, runoff, temperature and evaporation, it is economically preferable if a model that simulates the level variations on the basis of past level records (Sen et al., 2000).
Slivitzky and Mathier, 1993;Hubert et al., 1989;Vannitsem and Demaree, 1991;Sneyers, 1992;Kite, 1990, 1992;Meshkani and Meshkani, 1997;Sen et al., 2000;Jury and Gwazantini, 2002).
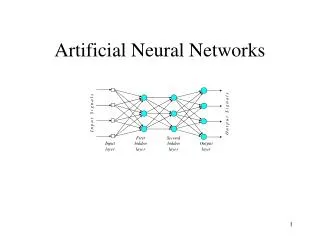
i j k Wij Wjk 1 1 1 2 2 2 3 3 3 INPUT OUTPUT 4 4 4 L M N Figure 1. Configuration of three-layer neural network
Each neuron in layers j and k receives the weighted sum of outputs NET from the previous layer as input. As an example, NET for layer j is given by (1) where j = a bias, or threshold value, for neuron j, that is trainable by treating it as a weight Wj in product with an output Op set equal to 1. Each neuron in layers j and k produces its output by passing its value of through a non-linear activation function. A commonly used functional form is the logistic activation function: (2)
The total error Ep, based on the squared difference between predicted and actual outputs for pattern p, is computed as (3) The goal of the training process is to present a sufficient number P of unique input-output pattern pairs, which when coupled with a suitable methodology for iterative correction of the interconnection weights, produces a final set of weights that minimizes the global error, E, defined as (4)
Data Data xmean (cm) Auto-correlations sx (cm) csx (cm) xmin (cm) xmax (cm) Training 1647 0.57 0.25 1646 1649 r1 r2 r3 r4 r5 r6 Training Test 0.986 1649 0.953 0.58 0.913 0.11 0.876 1648 0.848 1650 0.834 Entire Test 0.988 1648 0.958 0.91 0.921 0.65 0.888 1646 0.862 1650 0.844 Entire 0.999 0.999 0.999 0.999 0.999 0.999 Table 1. The statistical parameters of lake level data
The input combinations of lake level data evaluated in the present study are: 1) Lt-1; 2) Lt-1, Lt-2; 3) Lt-1, Lt-2, Lt-3; 4) Lt-1, Lt-2,..., Lt-4; 5) Lt-1, Lt-2, ..., Lt-5; 6) Lt-1, Lt-2, ..., Lt-6. The output layer had one neuron for current lake level Lt. Two and three-layered ANN were applied to each input combinations. The AR and MLR were also applied to the same data combinations. The results of ANN, AR and MLR were compared according to the MSE, MARE and R criteria. The MSE and MARE are defined as: (10) (11) where N and Yi denote the number of data sets and lake level data, respectively.
Model input Model input R MSE (cm2) ANN1 ANN1 ANN2 ANN2 AR AR MLR MLR Lt-1 Lt-1 0.988 0.0089 0.988 0.0084 0.975 0.0083 0.975 0.0083 Lt-1 and Lt-2 Lt-1 and Lt-2 0.994 0.0047 0.994 0.0044 0.988 0.4412 0.976 0.0230 Lt-1, Lt-2, and Lt-3 Lt-1, Lt-2, and Lt-3 0.992 0.0053 0.995 0.0052 0.990 0.0303 0.937 0.0485 Lt-1, Lt-2, Lt-3, and Lt-4 Lt-1, Lt-2, Lt-3, and Lt-4 0.993 0.0049 0.994 0.0041 0.990 0.6857 0.878 0.0042 Lt-1, Lt-2, Lt-3, Lt-4, and Lt-5 Lt-1, Lt-2, Lt-3, Lt-4, and Lt-5 0.0046 0.994 0.994 0.0041 0.990 0.0152 0.791 0.0707 Lt-1, Lt-2, Lt-3, Lt-4, Lt-5, and Lt-6 Lt-1, Lt-2, Lt-3, Lt-4, Lt-5, and Lt-6 0.993 0.0054 0.995 0.0034 0.990 0.6830 0.881 0.1297 Table 2. The MSEs and correlation coefficients of each model in testing period
Model input MARE (cm) ANN1 ANN2 AR MLR Lt-1 0.000046 0.000044 0.000044 0.000044 Lt-1 and Lt-2 0.000034 0.000033 0.000401 0.000074 Lt-1, Lt-2, and Lt-3 0.000036 0.000035 0.000100 0.000110 Lt-1, Lt-2, Lt-3, and Lt-4 0.000033 0.000032 0.000501 0.000130 Lt-1, Lt-2, Lt-3, Lt-4, and Lt-5 0.000033 0.000031 0.000067 0.000130 Lt-1, Lt-2, Lt-3, Lt-4, Lt-5, and Lt-6 0.000033 0.000028 0.000500 0.000180 Table 3. The MARE of each model in testing period
Fig. 2a. Comparison of ANN and AR or MLR estimates with the observed lake levels in the form of hydrograph.
ANN AR and MLR Fig. 2b. Comparison of ANN and AR or MLR estimates with the observed lake levels in the form of scatterplot.
The ANN1 and ANN2 input nodes consisting of Lt, Lt-1,…, and Lt-6provided the best match among the combinations tried • In general, both the ANN1 and ANN2 gave better forecasts than the AR and MLR. ANN2 had better forecasting performance than the ANN1 for the all input combinations tried in the study. • Based on these results, it is clear that the ANN technique is capable of modelling a lake level fluctuation. • The study only used data from one area and further studies using more data from various areas may be required to strength these conclusions