Download
1 / 1
10 likes | 110 Vues
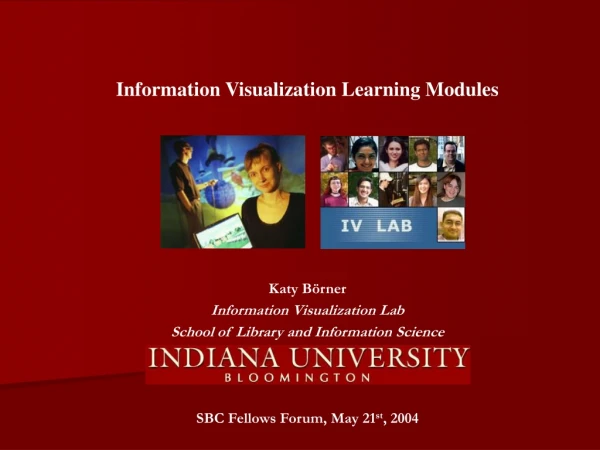
Information Visualization Learning Modules. Katy Börner, InfoVis Lab, School of Library and Information Science Indiana University, Bloomington. Motivation

E N D
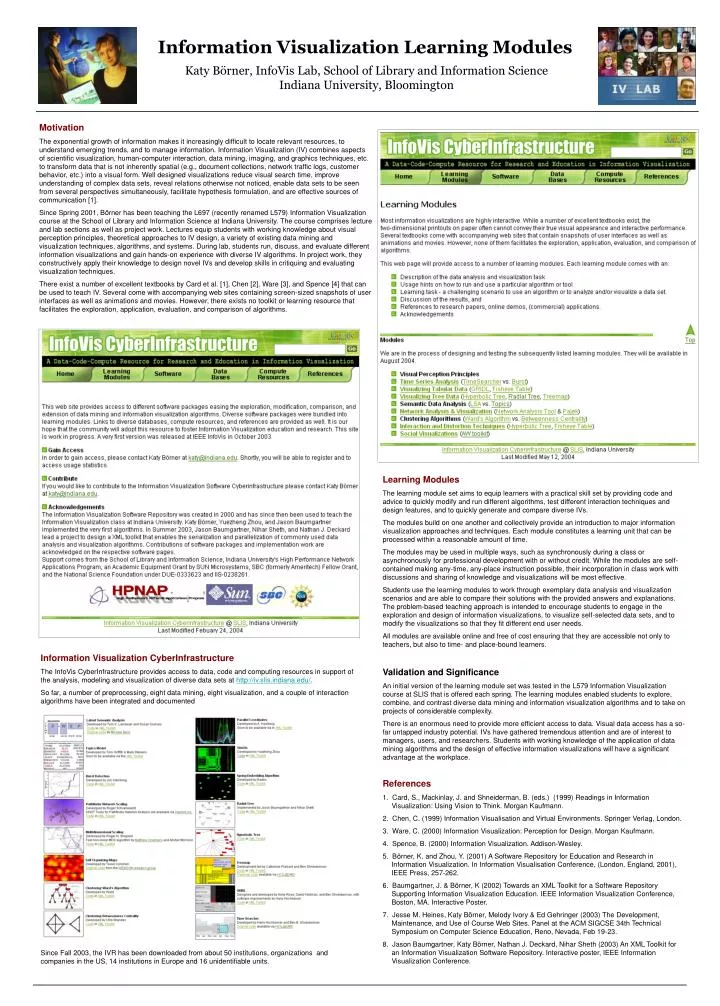
Information Visualization Learning Modules Katy Börner, InfoVis Lab, School of Library and Information Science Indiana University, Bloomington Motivation The exponential growth of information makes it increasingly difficult to locate relevant resources, to understand emerging trends, and to manage information. Information Visualization (IV) combines aspects of scientific visualization, human-computer interaction, data mining, imaging, and graphics techniques, etc. to transform data that is not inherently spatial (e.g., document collections, network traffic logs, customer behavior, etc.) into a visual form. Well designed visualizations reduce visual search time, improve understanding of complex data sets, reveal relations otherwise not noticed, enable data sets to be seen from several perspectives simultaneously, facilitate hypothesis formulation, and are effective sources of communication [1]. Since Spring 2001, Börner has been teaching the L697 (recently renamed L579) Information Visualization course at the School of Library and Information Science at Indiana University. The course comprises lecture and lab sections as well as project work. Lectures equip students with working knowledge about visual perception principles, theoretical approaches to IV design, a variety of existing data mining and visualization techniques, algorithms, and systems. During lab, students run, discuss, and evaluate different information visualizations and gain hands-on experience with diverse IV algorithms. In project work, they constructively apply their knowledge to design novel IVs and develop skills in critiquing and evaluating visualization techniques. There exist a number of excellent textbooks by Card et al. [1], Chen [2], Ware [3], and Spence [4] that can be used to teach IV. Several come with accompanying web sites containing screen-sized snapshots of user interfaces as well as animations and movies. However, there exists no toolkit or learning resource that facilitates the exploration, application, evaluation, and comparison of algorithms. Learning Modules The learning module set aims to equip learners with a practical skill set by providing code and advice to quickly modify and run different algorithms, test different interaction techniques and design features, and to quickly generate and compare diverse IVs. The modules build on one another and collectively provide an introduction to major information visualization approaches and techniques. Each module constitutes a learning unit that can be processed within a reasonable amount of time. The modules may be used in multiple ways, such as synchronously during a class or asynchronously for professional development with or without credit. While the modules are self-contained making any-time, any-place instruction possible, their incorporation in class work with discussions and sharing of knowledge and visualizations will be most effective. Students use the learning modules to work through exemplary data analysis and visualization scenarios and are able to compare their solutions with the provided answers and explanations. The problem-based teaching approach is intended to encourage students to engage in the exploration and design of information visualizations, to visualize self-selected data sets, and to modify the visualizations so that they fit different end user needs. All modules are available online and free of cost ensuring that they are accessible not only to teachers, but also to time- and place-bound learners. Validation and Significance An initial version of the learning module set was tested in the L579 Information Visualization course at SLIS that is offered each spring. The learning modules enabled students to explore, combine, and contrast diverse data mining and information visualization algorithms and to take on projects of considerable complexity. There is an enormous need to provide more efficient access to data. Visual data access has a so-far untapped industry potential. IVs have gathered tremendous attention and are of interest to managers, users, and researchers. Students with working knowledge of the application of data mining algorithms and the design of effective information visualizations will have a significant advantage at the workplace. Information Visualization CyberInfrastructure The InfoVis CyberInfrastructure provides access to data, code and computing resources in support of the analysis, modeling and visualization of diverse data sets at http://iv.slis.indiana.edu/. So far, a number of preprocessing, eight data mining, eight visualization, and a couple of interaction algorithms have been integrated and documented Since Fall 2003, the IVR has been downloaded from about 50 institutions, organizations and companies in the US, 14 institutions in Europe and 16 unidentifiable units. References 1. Card, S., Mackinlay, J. and Shneiderman, B. (eds.) (1999) Readings in Information Visualization: Using Vision to Think. Morgan Kaufmann. 2. Chen, C. (1999) Information Visualisation and Virtual Environments. Springer Verlag, London. 3. Ware, C. (2000) Information Visualization: Perception for Design. Morgan Kaufmann. 4. Spence, B. (2000) Information Visualization. Addison-Wesley. 5. Börner, K. and Zhou, Y. (2001) A Software Repository for Education and Research in Information Visualization. In Information Visualisation Conference, (London, England, 2001), IEEE Press, 257-262. 6. Baumgartner, J. & Börner, K (2002) Towards an XML Toolkit for a Software Repository Supporting Information Visualization Education. IEEE Information Visualization Conference, Boston, MA. Interactive Poster. 7. Jesse M. Heines, Katy Börner, Melody Ivory & Ed Gehringer (2003) The Development, Maintenance, and Use of Course Web Sites. Panel at the ACM SIGCSE 34th Technical Symposium on Computer Science Education, Reno, Nevada, Feb 19-23. 8. Jason Baumgartner, Katy Börner, Nathan J. Deckard, Nihar Sheth (2003) An XML Toolkit for an Information Visualization Software Repository. Interactive poster, IEEE Information Visualization Conference.