Download
1 / 5
50 likes | 148 Vues
200. 5000. 1500. 5000. ARR4. ARR5. ARR3. 4000. 1200. 4000. 150. 900. 3000. 3000. Expression level. 100. 600. 2000. 2000. 50. 300. 1000. 1000. 0. 0. 0. 0. ARR7. ARR8. ARR6. Expression level. - + - + - + - + BA. - + - + - + - + BA.

E N D
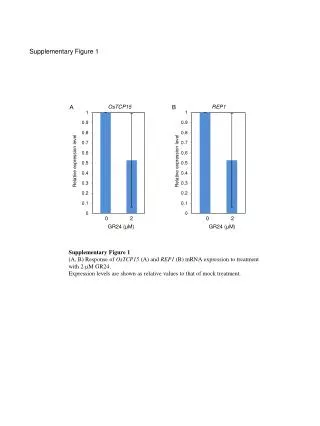
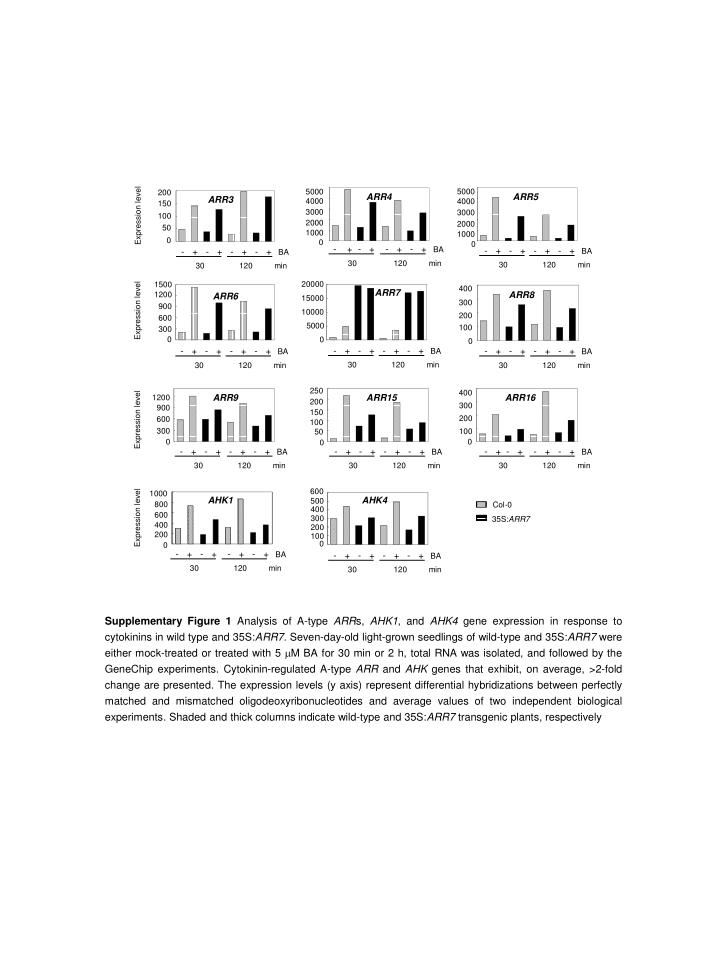
200 5000 1500 5000 ARR4 ARR5 ARR3 4000 1200 4000 150 900 3000 3000 Expression level 100 600 2000 2000 50 300 1000 1000 0 0 0 0 ARR7 ARR8 ARR6 Expression level - + - + - + - + BA - + - + - + - + BA - + - + - + - + BA ARR9 ARR15 ARR16 30 120 min 30 120 min 30 120 min 400 20000 Expression level 250 300 15000 200 200 10000 150 100 100 5000 50 0 0 0 600 1000 AHK1 AHK4 - + - + - + - + BA - + - + - + - + BA - + - + - + - + BA 1200 500 800 400 900 Expression level 30 120 min 30 120 min 30 120 min 600 300 600 400 200 300 200 100 0 0 0 - + - + - + - + BA - + - + - + - + BA - + - + - + - + BA 30 120 min 30 120 min 30 120 min 400 - + - + - + - + BA - + - + - + - + BA 300 30 120 min 30 120 min 200 100 0 Col-0 35S:ARR7 Supplementary Figure 1 Analysis of A-type ARRs, AHK1, and AHK4 gene expression in response to cytokinins in wild type and 35S:ARR7. Seven-day-old light-grown seedlings of wild-type and 35S:ARR7 were either mock-treated or treated with 5 mM BA for 30 min or 2 h, total RNA was isolated, and followed by the GeneChip experiments. Cytokinin-regulated A-type ARR and AHK genes that exhibit, on average, >2-fold change are presented. The expression levels (y axis) represent differential hybridizations between perfectly matched and mismatched oligodeoxyribonucleotides and average values of two independent biological experiments. Shaded and thick columns indicate wild-type and 35S:ARR7 transgenic plants, respectively
EXPA1 EXPA3 Expression level 600 3000 400 2000 EXPA4 200 1000 Expression level EXPA5 0 0 - + - + - + - + BA - + - + - + - + BA - + - + - + - + BA 30 120 min 30 120 min 30 120 min 1600 600 800 1200 600 400 1200 Expression level 800 400 200 800 EXPA10 400 EXPA6 200 400 0 0 0 - + - + - + - + BA - + - + - + - + BA - + - + - + - + BA 0 30 120 min 30 120 min 30 120 min 4000 3000 1600 Expression level 2000 1200 EXPA15 800 1000 0 400 0 - + - + - + - + BA - + - + - + - + BA 30 120 min 30 120 min EXPB3 Supplementary Figure 2 Analysis of expansin gene expression in response to cytokinins in wild-type and 35S:ARR7. Experiments were done and analyzed as described in the legend of Supplementary Figure 1
LBD4 400 LBD3 300 Expression level 200 100 0 - + - + - + - + BA - + - + - + - + BA 30 120 min 30 120 min 400 300 200 100 0 Supplementary Figure 3 Analysis of LBD gene expression in response to cytokinins in wild-type and 35S:ARR7. Experiments were done and analyzed as described in the legend of Supplementary Figure 1
160 120 120 80 80 40 40 0 0 - + - + - + - + BA CKX2 CKX3 30 120 min Expression level 600 1200 800 400 - + - + - + - + BA 200 400 30 120 min CKX5 CKX4 0 0 Expression level 500 400 200 - + - + - + - + BA - + - + - + - + BA CKXa 30 120 min 30 120 min Expression level 0 - + - + - + - + BA 30 120 min Supplementary Figure 4 Analysis of cytokinin oxidase gene expression in response to cytokinins in wild-type and 35S:ARR7. Experiments were done and analyzed as described in the legend of Supplementary Figure 1
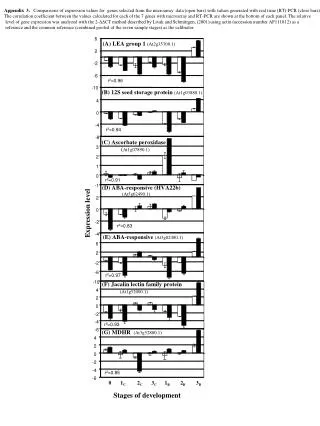
At2g30540 At3g62930 400 300 Expression level 200 100 0 - + - + - + - + BA - + - + - + - + BA 30 120 min 30 120 min At1g03850 At4g15680 Expression level 600 6000 4000 400 2000 200 0 - + - + - + - + BA - + - + - + - + BA 0 30 120 min 30 120 min 400 300 200 100 0 Supplementary Figure 5 Analysis of glutaredoxin gene expression in response to cytokinins in wild-type and 35S:ARR7. Experiments were done and analyzed as described in the legend of Supplementary Figure 1