Download
1 / 20
200 likes | 326 Vues
Formation of Interregional Distribution Grid Company JSC IDGC of the Center. December 20 , 200 7. Strategy of cost evaluation of IDGC/DGC and main proposals. Evaluation Strategy. Date of evaluation – June 30, 2007. Termination of prognostic period. –. 2015. DCF.

E N D
Formation of Interregional Distribution Grid Company JSC IDGC of the Center December 20,2007
Evaluation Strategy Date of evaluation – June 30, 2007 . Termination of prognostic period – 2015 DCF 100 % Switch during 2010-2012 to RAB regulation Main proposals - - - Restriction of transfer tariff growth in 2010-2014 Payment for connection is taken into account in proceeds, capital - , investments but is not considered in the capital base , Calculation is based on the net asset method . Expense approach 0 % Market value RCN (full replacement cost) = t Physical depreciation – External depreciation – External depreciation is defined as correlation between the existing capital investments and the required ones. Expense approach was not used because it is impossible to define the amount of external Depreciation during absence of the technical audit and detailed information ( load, transfer volume, etc) on each center of the distribution grid. , . Comparative approach Method of similar companies was not applied because the selected companies that render services on Transfer of electric energy do not possess characteristics necessary for applying the comparative approach – there is considerable difference in the scale, maturity, level of diversity and organisation models of their business. The transition method was not applied because the data on Purchase contracts of distribution grid assets is absent due to the business monopoly. - , 0 % – .
Main propositions of DCF evaluation Macroeconomic indicators Deloitte Regulation RAB regulation Expenses + Transition period Fixed assets 1H2007 (re-estimated according to Russian Accounting Standards) + investments (without payment for Connection) + circulating capital Capital base Electric energy Business plans of DGC Growth rates included (Deloitte)* supply Volume of losses Business plans of DGC By 2015 is to enter the target level г Payment of losses Business plans of DGC According to day-ahead prices (Deloitte) Operational expenses Business plans of DGC - Inflation growth rate included Capital investments At the amortization level of the previous year Business plans of DGC - Restriction of Tariff growth Business plans of DGC - At inflation growth rate of + 4%** 2 H 2007 2008 2009 2010 201 1 2011 2012 2013 2014 2015 * * Plan of organic growth** On the basis of average historical exceeding of the tariff growth over inflation.
Profit of the capital base Capital basex WACC (regulatory) = + + Return on the capital base Necessary gross returnby RAB method Operational expenses Calculation of tariffs according to the method of the investment capital profitability (RAB) It is supposed that from 2010 to 2012 Expenses+ strategy of tariff regulation on transfer of e/energy through distribution grids will be replaced by the method of profitability of the invested capital ( RAB –return on Regulatory Asset Base). The essence of RAB strategy is guarantee of full return of the means invested into the assets of the company during the fixed period that corresponds to the terms of validity of the assets and reception of the stable income the level of which is defined by the regulator that must conform to the risk profile of DGC and guarantee attractiveness of the branch for the investors. Operational expenses include all the field costs of the company except for amortization of the fixed assets, intangible assets. Return on the capital base must guarantee reproduction of the assets that are effectively used at transfer of electric energy through DGC’s grids. Profit of the capital baseis defined by the norm of profitability (regulatory WACC) fixed by the regulator the stake of which will be fixed for the long-term period of regulation equal to all DGC.
Calculation of the capital base for tariff calculation by RAB method For the purpose of correct prognosis of indicators of the operational activity of the distribution grid companies after switch to the system of regulation of their tariffs on the basis of RAB method, calculation of the regulator capital base for the moment of the planned introduction of new rules of tariff design (beginning of 2010) was realised. Regulatory capital base (as of the beginning of 2010) + Cost of capital investments for 2H2007-2009. + = Circulating capital as of the beginning of 2010 Initial capital as of the beginning of 2010 Investments on the level of amortization of the previous year - + + = Change of the circulating capital Regulatory capital base of the previous year Regulatory capital base Amortization The initial capital is defined as the cost of the fixed assets that are on the balance of the company as of June 30,2007 and that were re-estimated according to Russian Accounting Standardsfor the end of 2009. Capital investments for 2H2007-2009from business plans of the companies Circulating capitalis defined on the basis of the existing circulation factors and their correspondence to average branch indicators during the accounting period. In the following years of the regulation period the regulatory capital base is calculated by the following way:
Calculation of the capital base for tariff calculation by RAB method • The initial capital used for defining of the regulatory capital baseas ofthe beginning of 2010is defined as the full cost of asset replacement with regard of their physical depreciation: • The initial capital is defined proceeding from the current legislation concerning estimation of cost of the fixed assets for the purpose of book keeping • Only the industrial assets are included into initial base of the invested capital (OL, substations, transformer substations), non-profile assets are not considered at calculation of the capital base • The investments that were realised at the expense of payment for technical connection are not included into the capital base in order to avoid double calculation. • Full cost of replacement is defined as cost of production or construction under the current conditions of the similar new object that by its functional characteristics is as much as possible similar to the estimated object. • Physical depreciation is price decrease due to depreciation, dilapidation and aging, and also deterioration of properties that cannot be eliminated at the expense of the current service.
Calculation of WACC rates Cost of the owned capital Risk-free rate (nominal) 5.21% Market premium 5.50% Beta (unlevered) 0.87 Corrected Beta ratio 0.60 Country risk 0.01 Specific risk for the reformation period 0.00% Final cost of the owned capital of the company 10.95% Premium for small-cap 2.28% – 6.27% Debt capital cost Cost of debt funds (before taxation) 10.32% Tax profit rate 24.00% Cost of debt funds (after taxation) 7.84% Structure of the capital Target correspondence of debt to owned capital 61.00% WACC for discounting 11.18% – 13.67% Regulatory WACC before taxation 9.78% Regulatory WACC after taxation 12.86% Discount rate and regulatory norm of profitability
6 months of Indicators 2008 2009 2010 2011 2012 2013 2014 2015 2007 Inflation in the RF,CPI 4,50% 8,00% 7,60% 7,10% 6,50% 6,00% 5,50% 4,50% 4,00% Cumulative inflation index 108,00% 116,20% 124,50% 132,50% 140,50% 148,20% 154,90% 161,10% 167,50% Price index in the industry 4,90% 9,00% 8,00% 7,00% 6,50% 5,50% 5,00% 4,00% 3,50% of the RF, PPI Pay index in the RF 10,10% 13,00% 12,00% 11,00% 13,00% 9,00% 8,00% 7,00% 7,00% Exchange rate ruble/ US dollar 26,50 27,20 28,20 29,00 29,10 30,04 30,85 31,39 31,79 (average annual) Inflation in the USA, CPI 1,80% 2,50% 2,50% 2,50% 2,50% 2,50% 2,50% 2,50% 2,50% Source: documents adopted by the Evaluation Committee under the Board of Directors of JSC RAO UES of Russia Macroeconomic assumptions Macroeconomic assumptions for model building Calculation of flat cost is based on the following assumptions: • The main cost items are predicted on the basis of price indexes in the industry of the RF. • Wage expenses are predicted in accordance with the pay indexes • Prognosis of electric energy losses in physical terms is based on linear variation of the given indicator during the horizon period and achievement of the target indicator by 2015 • Prognosis of electric energy losses in percent to net supply for 2015 is provided by JSC UES FGC
Review of indicators of DGC that are included in the zone of responsibility of JSC IDGC of the Center
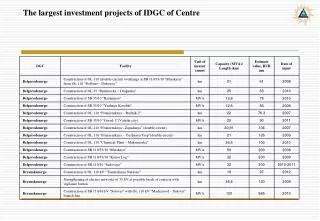
IDGC of the Center Geographical position of IDGC Length of OL in DGC, km Investment requirements of DGC, billion rubles Summed installed capacity of TCP and Sb, MVA Depreciation of the fixed assets, % Twerenergo, 1.8 62,50% Bryanskenergo 1.9 Orelenergo 1.4 Yarenergo, 2.6 Tambovenergo 1.3 Voronezhenergo, 2.9 Kurskenergo, 2.8 55,00% Lipetskenergo, 4.7 Kostromaenergo, 1.4 Belgorodenergo, 7.3 47,50% Smolenskenergo, 2.7 Refusals of connection, МВА 40,00% 0 150 300 450 Data: Business plans of DGC
IDGC of the Center Proceeds 15 820,6 mln.rbl. ** Length367.7 thous.km.* Power 1 318,8 thous. c.u.* Productive supply27958,2 Mio.kWh ** * Data as of the end of the 1st half of 2007 ** for the 1st half of 2007.
IDGC of the Center Amount of losses at transfer of e/e in 2006, % Investment program of DGC for 2Н2007-2010, mln rbl. Correlation – transfer of e/e (mln kW*hour)/ length of OL (km) in 2006. Productive supply and losses of e/e in DGC in 2006, mln. kWhour Data: DGC Business plans
Stake of DGC at technical connection to IDGC of the Center* Stake of RAO UES – 50.23% * On the basis of the assumption that all DGC will take resolutions on reorganisation of the companies in the form of connection to the corresponding IDGC, without consideration of the stake of the existing IDGC.
IDGC of the Center Economic indicators of work of DGC for 2006 and 1st half of 2007 * Productive supply of e/e (with regard of losses) in 2006, mln kW*hour Productive supply of e/e (with regard of losses) for the 1st half of 2007, mln kW*hour Losses in 2006, mln kW*hour Amount of losses in 2006, % Proceeds in 2006, thous.rbl. Proceeds for the 1st half of 2007, thous. rbl. Tariffs on transfer of e/e in 2006, rbl/MW*hour JSC Belgorodenergo 9 580,4 5 006,4 795,4 7,7% 4 962 756,7 3 328 613,4 480,2 JSC Bryanskenergo 3 767,5 1 920,7 206,8 5,2% 1 527 536,0 1 389 297,9 400,0 JSC Voronezhenergo 7 289,1 3 636,3 871,4 10,7% 2 756 784,1 1 620 382,7 372,8 JSC Kostromaenergo 2 485,0 1 271,4 508,6 17,0% 1 664 313,8 995 249,7 640,6 JSC Kurskenergo 5 152,0 2 556,0 580,0 10,1% 2 398 718,0 1 216 634,4 460,9 JSC Lipetskenergo 6 973,6 3 475,1 661,5 8,7% 2 524 778,5 1 520 684,2 333,5 JSC Orelenergo 2 248,8 1 075,8 357,4 13,7% 1 085 440,0 732 802,0 473,7 JSC Smolenskenergo 3 265,5 1 623,1 719,7 18,1% 2 316 465,9 1 203 321,6 660,2 JSC Tambovenergo 3 038,1 1 527,6 253,8 7,7% 1 423 596,0 737 977,0 463,9 JSC Twerenergo 4 500,7 2 292,6 812,8 15,3% 2 378 545,0 1 370 221,3 514,6 JSC Yarenergo 5 743,4 3 573,2 470,8 7,6% 2 872 758,8 1 705 374,3 481,8 Total 54 044,1 27 958,2 6 238,2 25 911 692,6 15 820 558,5 Length of OL by classes of voltage,km OL 110-150 kV, km OL 35 kV, km OL 1-20 kV, km OL 0,4 kV, km Rate of OL110-150 kV, % Rate of OL 35 kV, % Rate of OL 1-20 kV, % Rate of OL 0,4 kV, % JSC Belgorodenergo 1 645 2 450 17 454 15 333 8% 8% 10% 11% JSC Bryanskenergo 1 751 1 755 12 333 10 481 8% 6% 7% 7% JSC Voronezhenergo 3 105 3 685 20 452 23 059 15% 12% 12% 16% JSC Kostromaenergo 1 770 2 549 11 497 9 014 8% 8% 7% 6% JSC Kurskenergo 1 909 2 824 15 007 13 735 9% 9% 9% 9% JSC Lipetskenergo 1 517 2 311 11 706 10 339 7% 8% 7% 7% JSC Orelenergo 1 361 1 864 12 877 11 712 6% 6% 8% 8% JSC Smolenskenergo 2 561 3 770 19 120 12 118 12% 12% 11% 8% JSC Tambovenergo 1 876 3 155 11 896 11 803 9% 10% 7% 8% JSC Twerenergo 2 720 3 988 26 317 17 321 13% 13% 15% 12% JSC Yarenergo 1 030 2 084 12 024 10 396 5% 7% 7% 7% Total 21 245 30 435 170 683 145 311 100% 100% 100% 100% *Preliminary data for the 1st half of 2007 Source: Business plans of DGC
Technological connection- refusals in connection for 2006 – 1st half of 2007. Source: data of UES FGC
System of standard units According to the System of standard units for distribution of the general tariff proceeds by classes of voltage adopted by Decree N 25/3 ofthe Energy Commission of the RF as of May 12, 2000 as appendix to the Strategy of calculation of the amount of payment for the services on transfer of electric energy: • Amount of the overhead power transmission lines (OPTL) and cable power transmission lines (CPTL) is defined in standard units depending from length, voltage,design and material of the supports *: PTL Voltage, kV Amount of chains on the support Material of the supports Amount of standard units for 100 km of OL right-of-way OPTL 110-150 1 wood 180 Metal 160 ferroconcrete 130 2 metal 270 ferroconcrete 180 35 1 wood 170 metal 140 ferroconcrete 120 2 metal 180 ferroconcrete 150 1-20 1 wood 160 Wood on ferroconcrete stubs 140 ferroconcrete, metal 110 0,4 1 260 220 150 CPTL 110 2300 20-35 470 3-10 350 Up to 1 kV 270 • Amount of substations, transformer substations (TS), complex transformer substations (CTS),etc. *: Name Measurement unit Amount of standard units for 1 measurement unit 110-150 kV 35 kV 1-20 kV Substation SB 105 75 - Power transformer (one- or three-phase) or reactor or booster transformer Equipment unit 7,8 2,1 1,0 One-transformer TSB, CTSB TSB, CTSB - - 2,3 Two-transformer TSB, CTSB TSB, CTSB - - 3,0 One-transformer substation 34/0,4 kV SB - 3,5 - * Extracts on certain kinds of equipment are presented

![Formation of a Company [2]](https://cdn4.slideserve.com/726398/slide1-dt.jpg)