Download
1 / 115
1.16k likes | 1.27k Vues
Seminar in Conference Center Vltava, Rez, CR. System Analysis of the Power in 21 Century P. Alekseev (RRC “Kurchatov Institute”). March, 4, 2009. С ontents.

E N D
Seminar in Conference Center Vltava, Rez, CR System Analysisof the Power in 21 CenturyP.Alekseev(RRC “Kurchatov Institute”) March, 4, 2009
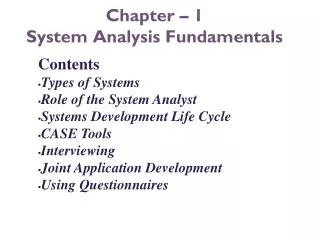
Сontents 1.Nuclear Power – Real Energy alternative in XXI century.2.Multi-component Innovative Nuclear System (INS) with Closed Nuclear Fuel Cycle (CNFC).3.Strategy of development of nuclear power in Russia.4.Basic problems of large-scale Nuclear Powerfuel cycle development.5.Use of thermonuclear neutrons in nuclear power of fission.Conclusion.
Energy resource distribution. Industrial &Household Transportation Electricity and Heat (1830 Mtoe) (4500 mtoe ) (3800mtoe) 3700 мtoe 2400 мtoe 2200 мtoe 1100 мtoe 690 мtoe 300 мtoe Biomass& waste Coal Gas Renewable Nuclear Oil Structure of consumption primary energy resources(2005)
Growth of global consumption of energy in 21 century. Рrincipal causes. • Growth of the population in the world. By modern estimations the population of the Earth to the middle of this century will increase approximately in 1,5 times (up to a level 10 billion person). Data about change of a population in the different countries and regions of the world <http: // www.census.gov/ipc/prod/wp02/>. • Technological rapproachement of the developed and developing countries. If there will be an alignment of specific consumption of energy in the developed and developing countries, on what the tendency of last years demand for power resources to 2050 can increase three times in comparison with a modern level specifies. Data about consumption and manufacture of primary energy sources (oil, gas, coal, electric power, full consumption of energy) in the different countries of the world since 1965 (<http: // www.bp.com/>, <http: // www.iea.org/>, <http: // www.eia.doe.gov/>).
Distribution of energyconsumption in the world People distribution versus energy consumption level Alignment of energy consumption Primary energy recourses need Main problem – alignment of energy consumption
The reasons for development of NP. • Rate of growth of consumption of organic fuel essentially surpasses speed of updating of its resource base. Therefore, it is quite probable, that to the middle of a current century it will be impossible to provide demand for energy due to traditional technologies of use of fossilresources of organic fuel. • Use of organic fossil fuel is carried out mainly by its burning that leads to huge quantityof annual harmful emissions in an atmosphere. Development of such negative large-scale ecological phenomena is connected with power on organic fuel, as «acidulation» deposits and "hotbed effect".
Generally Hubert oil peak (maximum of production on given territory, including whole world) denotes that about one half of resources were already exhausted.
IEA, Global Energy Outlook, 2003. Resources and consumption of oil and gas (contemporary estimation and increased resources, in 2 times) rate of commissioning of new resources or technologies is not acceptable for liberalized economy It can be expected that already in 10 years from now it will be necessary to consider NE as the necessary stabilizing factor of sustainable development of the whole power sector.
Oil recovery (Go 453 bil. t) ( Go 800 bil. t) Млн. тонн Млн. тонн 152 billion tons have been already extracted from 164 billion tons of proven resources Gas recovery (Go 310 trill. cub. m) (Go 800 trill. cub. m) Млрд. м3 Млрд. м3 By now: 86 trill. m3extracted.Proven reserves=180 trill. cub. m.
Energy resources availability depending on their extraction cost Gas U-238 Coal Oil Fuel recourses, EJ Integral primary Energy consumption In the 21 century (medium scenarios) U-235 extraction cost, USD/GJ “?” What it is easier – to change economic way,or to create NP system adequate to principles of sustainable development,providing access to remote resources of poor quality – creation of NP system capable effectively to use uranium - 238 and thorium in the closed fuel cycle? 14
Data on change of gross national product of the different countries since 1980 (http://www.imf.org , http://www.bp.com/statisticalreview ).
Power safety of the modern world • Today all world has faced with serious power challenges. • Among them: • Exhaustion of power resources at the extremely non-uniform distribution; • Prompt growth of consumption of energy and accordingly, the increased power loading on the nature; • Significant growth of cost of all power resources, including uranium. • The concept of global steady development and restriction of influences of power on climatic changes becomes more and more dominating in the world. 2050/2007 Oil 0.9 times Gas1.1 times Coal 4 times Biomass3 times Hydro2 times Renewable 9 times NE3times
Oil 0.9 times Gas1.1 times Coal 4 times Biomass3 times Hydro2 times Renewable 9 times NE3times
Evolution of sights at developmentNE 2008-2010 (forecast) NP 2000GWto2050year 2005 NP 1000GWto 2050year 2000 NPis not necessary 38 mil. ton Unat 12.5 mil. ton Unat 3.6mil. ton Unat NP is very important for the world Such a scale demands the international cooperation, international plants of the fuel cycle Control extension opportunities NP almost in all countries It is not important of the world power It is practically impossible to supervise proliferation NP in a small number of countries It is not important for the world power It is difficult to supervise proliferation Nonproliferation
Scenarios and ranges of projected installed nuclear capacity
Consumption of natural uranium in XXI century for different scripts, millions tons 35 30 25 20 Red Book, 15 million tons (2005) 15 10 5 0 The forecast of 2000 The forecast of 2005 В2- 2000 GW 360GW 1000GW Open fuel cycle NP Frequency of YM building В2 –The "average" scriptIPCC (2000 )
Problems of modern NP • Modern NP cannot be considered as basis of sustainable development for the following reasons: • Inefficient use of fuel (the effective resource is less, than at oil and gas); • Degradation of neutron potential (absence of breeding of nuclear fuel); • Accumulation of waste of proportionally made energy (there comes that moment when the tariff will not suffice for service of waste); • Limitation of scales, spheres and regions of use; • Increase of threat of uncontrollable use of nuclear materials.
2. Multi-component Innovative Nuclear System (INS) with Closed Nuclear Fuel Cycle (CNFC)
A.P.Aleksandrov(А.П.Александров): «The future large scale NP should be capable (in sense of nuclear fuel) to sustainable development...with feeding in fuel cycle from the outside only not scarce U-238 ». « Nuclear power and its role in technical progress » - the General address read at opening of VII World power congress, 1968. «Будущая крупная атомная энергетика должна быть способной (в смысле ядерного топлива) к саморазвитию... с подачей в топливный цикл извне только недефицитного U–238». «Ядерная энергетика и ее роль в техническом прогрессе» - Генеральный адрес, зачитанный на открытии VII Мирового энергетического конгресса, 1968 г.
Difference of neutron balance for Reactor and INS • The potential of neutron balance in a reactor at fissioning of uranium-235 and 233, plutonium 239, 241 is defined by size (--α. • The potential of neutron balance in system AE at use of all uranium-238 or thorium-232 is defined by size (--α-. Surplus of neutrons in a reactor allows to spend them for simplification of the decision of problems of convenience of operation, safety and economic efficiency. At the decision of a problem of reproduction of nuclear fuel the problem of realisation of the necessary neutron balance in system strongly becomes complicated.
Surplus of neutrons at full "burning" various nuclides The balance of neutrons allows to solve problemsof supply of fuel and transmutation in structure of nuclear power
User requirements Basic principals Guides, rules • INS: • NFC enterprises • Thermal reactors • Fast reactors • Burner reactors Fission products, Useful radio nuclides, Energy U-235 U-238 Th-232 Non nuclear recourses
Scenario: 1500GW in 2050; 5000GW in 2100 Closed fuel cycle with recycling of uranium Increased burn up in LWR-M – 60 GWd/t Cosumption of natural uranium up to 2100 30 million t Consumption of natural uranium 650000 t/year and separation work 800 MSWU in 2100 (In 10 times more in comparison with 2007 year) Capacity of fuel reprocessing : 2050г:-20000 tSF/year 2100г.-40000 tSF/year
Scenario: 1500GW in 2050; 5000GW in 2100 FBR-S: BR=1.05 Increased burn up in LWR-M – 60 GWd/t Cosumption of natural uranium up to 2100 17 million t in comparison with an open fuel cycle of 30 million t Maximum of consumption of natural uranium in 2100г at level 40000 t/year. (In 7 times more in comparison with 2007г) Volume of fuel reprocessing: 2050г:-20000 tSF/year 2100г.-60000 tSF/year
Scenario: 1500GW in 2050; 5000GW in 2100 BN-1800: BR=1.2 Burn up LWR-M – 60 GWd/t Consumption of natural uranium up to 2100 15.5 million t in comparison with an open fuel cycle of 30 million t Volume of processing of fuel: 2050г:-20000 tSF/year 2100г.-60000 tSF/year
Scenario: 1500GW in 2050; 5000GW in 2100 FBR-S: BR=1.6 Raised burning out LWR-M – 60 GWd/t Consumption of natural uranium up to 2100 4.25 million t in comparison with an open fuel cycle of 30 million t Volume of processing of fuel: 2050г:-40000 tSF/year 2100г.-90000 tSF/year
Basic Fuel Cycle Parameters for Various Scenarios (5000 GWe by 2100) Maximum SWU, t/y Natural U demand, million tons 800000 35 700000 600000 30 500000 400000 25 300000 20 200000 100000 15 0 CFC (BR=1.25) CFC (BR=1.6) OFC CFC (burner) 10 5 0 OFC CFC (burner) CFC (BR=1.25) CFC (BR=1.6) Maximum natural U consumption, million t/y 0.7 Maximum SNF reprocessing, t/y 0.6 0.5 0.4 140000 0.3 120000 0.2 100000 0.1 80000 FR 0 CFC (burner) CFC (BR=1.25) CFC (BR=1.6) 60000 TR OFC 40000 20000 Current status: Natural uranium consumption0.07 million t/y SWU60 000 t/y SNF reprocessing6 000 t/y 0 CFC (BR=1.6) OFC CFC (burner) CFC (BR=1.25
Multi-component InnovativeNuclear System with Closed Fuel Cycle for all Actinides Mining Enrichment U Enriched U Depleted U Fuel Fuel Neutron Pu fabrication fabrication Source Thermal Fast Molten-salt Pu, U Pu reactors reactors reactor-burner Pu, MA, Th I-129, Tc-99 Aqueous Non-aqueous Separation reprocessing reprocessing process Pu FP 1 TRU Intermediate storage Final disposal Example of INS (Russia)
Reactors tasks • thermal power reactors - wide field of application, minimization of the plutonium equilibrium quantities in the INS (BR~0.8-0.9); • fast power reactors - provision of neutrons balance in the INS (BR~1.3-1.5); • molten-salt reactors-burner - minimization of the minor actinides quantity in the INS.
NPP Leasing of reactors MOX fuel MOX fuel fabrication FR Storage of SNF (FR) Depleted uranium Radwaste isolation SNF reprocessing SNF (LWR) Storage of SNF (LWR) SNF (LWR) SNF (LWR) Uranium fuel Uranium fuel fabrication Uranium enrichment Storage of depleted uranium Natural uranium 2025 2015 The international centers of a nuclear fuel cycle
Production and trans-regional flows of fresh and irradiated nuclear fuel by 2050 t/year, N=2000 GW, “traditional” model
Production and Trans-Regional Flows of Fresh and Spent Nuclear Fuel by 2100, t/y, N5000 GW
Role innovative NS in global power • The innovative nuclear system provides the scale manufacture of energy possessing long-term resource base and weak dependence on region of extraction of natural uranium. • The innovative nuclear system will be based on the closed fuel cycle with reactors on fast neutrons as the cores breeders offuel and the sources of the electric power using an isotope of natural uranium - uranium-238 (thorium-232). • Conceptual basis of a choice of a base variant of structure of innovative nuclear system, nuclear fuel cycle and the nuclear industrial complex, providing performance of priority tasks with the least technical risk
Boundary conditions of NP development in Russia: Creation of integral system (corporation – Sredmash XXI century) - « from cradle to grave» International projects (INPRO, Generation 4, GNEP, international NFC centers), new opportunities for use of global experience and large scales of involved resources Globalization of the markets of energy and finance: economic risks; political risks The end of great geological discovery epoch - rise in price of uranium and all other resources Complication and increase in scales of the systems demanding the qualified highly paid staff (demographic restrictions) 42
General Company Information JSCAtomenergopromwas established in2007according to Russian Federation Presidential Decree № 556 of 27.04.2007 aimed at consolidating the civil sector of nuclear industry into an integrated full-cycle company of an international scale and at increasing its efficiencyandat enhancing its competiveness. The charter was approved by Russian Federation Government Resolution №432 of 06.07.2007 The State Corporation Rosatom owns 100% shares of JSC Atomenergoprom(Federal law N 317-FLof 01.12.2007) Shares of 89 enterprises of Russian nuclar industry will be contributed into equity of JSCAtomenergoprom(incl. 31 JSC, 55 FSUE, 3 FSEI) The staff totals approximately 188,000 employees. Government Support:Federal Target Program “Developmentof Nuclear Power and Industry Complex of Russia in 2007-2010 and until 2015» envisions financing totaling1,471.4 bln RUR.
Atomenergoprom is the system-forming player in Russian nuclear industry • 100% owned by the State Nuclear Power Corporation Rosatom - Unites 89 civil nuclear enterprises of Russia and their affiliates ROSATOM ATOM ENER GOPROM NWC SCIENCE NRS Design and Engeneering of NPPs in RF Power generation Mining Conversion Enrichment Fabrication Power Machine Engeneering Nuclear construction abroad ROS ENERGO ATOM ARMZ TENEX TVEL ATOM ENERGO MASH AEP(Moscow)AEP(St.P) AEP (NN) ATOM STROY EXPORT
Mission Atomenergoprom missionis to provide safe and effective economic development, higher standard of living and preservation of the environment. Atomenergoprom is focusing on development of a society where atomic energy is ecologically clean, safe and affordable. The company aims at being a responsible member of the world community, known and respected all over the world. Core strategic principle– technological leadership in the global nuclear industry. Company’s strategy is to advance to both unification and technologicalimprovement of the product anddiversification of sources of revenuesandthe geographic expansion.
Technology Chain Fuel fabrication Research and development Uranium mining Conversion and enrichment NPP construction Manufacturing of gas centrifuge Machine engineering Generation Spent nuclear fuel management
Operating reactors worldwide Toshiba/ Westinghouse 117 AREVA 95 3rdworldwide by quantity Atomenergoprom 69 GE-Hitachi 64 AECL 29 MHI 18 KHNP 8 units Toshiba/ Westinghouse 108 AREVA 101 GE-Hitachi 56 Atomenergoprom 4thworldwide by installed capacity 49 AECL 18 MHI 15 KHNP 8 GW Source: Atomenergoprom
Novovoro-nezh-2 3 Tver 1 Seversk 1 Leningrad-2 3 General Allocation Plan: Comissioning of NPPs by 2020 Base scenario of NPP units construction according to the General Allocation. +32.3 GW of commissioned units. Central - 4 + 5.8 GW Nizhniy Novgorod - 4 Expanded scenario of NPP units construction according to the General Allocation. Units are commissioned +5.8 GW relative to base scenario. Pevek Floating NPP Central - 3 Novovoro-nezh-2 4 ЦЕНТР - 3 Installed capacity of NPPs in Russia in 2020: base scenario – 53.2 GW,expanded scenario – 59 GW Primorskaya 1 Primorskaya 2 Kola 2-1 Kola 2-2 Kola 2-3 Kola 2-4 Tver 4 South Urals 1 South Urals 2 Central 2 Central 1 + 32.3 GW Beloyarsk BN-800 South Urals 3 Severodvinsk Floating NPP Leningrad-2 2 Seversk 2 Novovoro-nezh-22 Nizhniy Novgorod 2 South Urals 4 Nizhniy Novgorod 1 Kalinin 4 Rostov 3 Leningrad-2 4 Rostov 2 Nizhniy Novgorod 3 Leningrad-2 1 Kursk 5 Rostov 4 Novovoro-nezh-2 1 Tver 2 Tver 3 2008 2009 2010 2011 2012 2013 2014 2015 2016 2017 2018 2019 2020
World Nuclear Fuel Cycle Company’s Position *Kazatomprom has only production of uranium dioxide powder (25%) and fuel pellets (9%)
Estimation of power resources of Russia U-238 - 86,7% Coal - 8,7% U-235 - 0,4% Oil - 0,8% Gas - 3,4% (Source of data: data of Federal Agency of the Russian Federation on use of bowels – Rosnedra)