Download
1 / 17
170 likes | 290 Vues
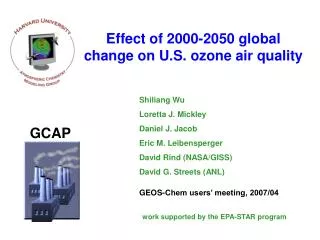
Effects of 2000-2050 global change on U.S. ozone air quality. Shiliang Wu (Harvard) Loretta J. Mickley (Harvard) Daniel J. Jacob (Harvard) David Rind (NASA/GISS) David G. Streets (ANL) AGU Fall meeting, 2006. work supported by the EPA-STAR program. Probability of max 8-h O 3 > 84 ppbv.

E N D
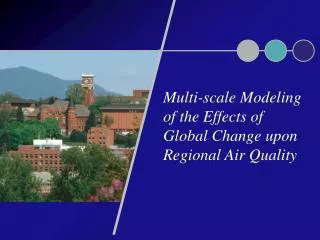
Effects of 2000-2050 global change on U.S. ozone air quality Shiliang Wu (Harvard) Loretta J. Mickley (Harvard) Daniel J. Jacob (Harvard) David Rind (NASA/GISS) David G. Streets (ANL) AGU Fall meeting, 2006 work supported by the EPA-STAR program
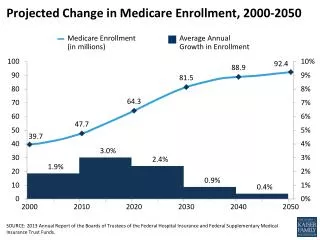
Probability of max 8-h O3 > 84 ppbv Background - We are facing rapid global change 1. Anthropogenic emissions of ozone precursors 2. Climate change IPCC [2001] Ozone air quality correlates strongly with temperature Lin, et al. [Atm. Env. 2001] IPCC [2001]
GISS GCM III 23 vertical layers extending to 85 km Horizontal resolution of 4º x 5º GEOS-Chem detailed ozone-NOx-VOC-aerosol chemistry Anthropogenic emissions (IPCC A1B scenario) Radiative forcing GHG Air pollutants & their precursors Natural emissions Chemistry, transport, deposition, etc Climate Change Models and future scenarios Simulated 2000-2050 changes in global annual mean surface temperature = + 1.7oC
Growth factors for NOx emissions (future / present) Biomass burning fossil fuel A1B 2000-2050 changes in NOx emissions 4 groups of simulations
Present-day conditions Effects from climate change Combined effects Effects from emission change Effects of 2000-2050 global change on U.S. ozone air quality Daily max 8h-avg ozone averaged over JJA (ppb) Increase of summer max-8h-avg ozone by 2-5 ppb in large areas of U.S. due to 2000-2050 climate change. Less effects in western U.S. because (1) anthro. emissions there are low (2) increase of ozone from inter-continental transport.
Change of convective mass flux at 850 hPa (future/present) Change of afternoon PBL (future / present) Factors causing worse O3 AQ with the future climate Change of surface Temp. (future – present)
Max. 8-hr-avg ozone Cumulative probability (%) Cumulative probability (%) Midwest Northeast Southeast Cumulative probability (%) Cumulative probability distributions of max 8-hr ozone (JJA) global change has more effect on the pollution events than on the means Max. 8-hr-avg ozone Northeast Midwest Present Future climate Future emissions Future climate & emis Cumulative probability (%) Max. 8-hr-avg ozone No effects from climate change? Southeast
Isoprene + OH RO2(OH sink) O3 RO + NO2 (O3 formation) Isoprene + O3 M (O3 sink) Why is SE U.S. ozone insensitive to climate change? Competing effects of isoprene on ozone RO2 + NO RONO2 (sink for NOx) O3 Isoprene emissions Isoprene emis +30% Δ(O3) present future / present
Change of summer average max-8h ozone due to climate change Present emissions Future emissions (ppb) Mitigation of climate penalty by emission reductions in ozone precursors “climate penalty” for ozone air quality = Δ[O3] from climate change Reductions of anthropogenic emissions significantly mitigate the “climate penalty” and can even turn it into a “climate benefit” in southeast and northwest U.S.
Regional average summer max-8h ozone (ppb) Mitigation of climate penalty by emission reductions - continued Climate penalty is turned into climate benefit by emission reductions “climate penalty” Climate penalty is mitigated by emission reductions Q: Is climate change bad for O3 AQ? A: That depends. With present-day anthropogenic emissions – BAD for most places. With the reduced anthropogenic emissions – Not that bad; or even GOOD for some regions (e.g. southeast and northwest)!
Present-day Effects from climate change Effects from emission change Combined effects Effects of 2000-2050 global change on Policy Relevant Background (PRB) ozone PRB ozone = Ozone levels that would exist in the absence of anthropogenic emissions from U.S., Canada and Mexico Decrease of background ozone in response to climate change except in the middle U.S. where NOx emissions from soil increases. Fossil fuel and biofuel emissions over North America are turned off. Increase of bkgd ozone, especially in western U.S., mainly due to increased inter-continental transport from Asia; increase of biomass burning over NA also contributes.
Conclusions Climate change could worsen ozone air quality in U.S.; the summer average daily max-8-hr ozone is projected to increase by 2-5 ppb over large areas of U.S. due to the 2000-2050 climate change with the IPCC A1B scenario. Factors causing worse ozone air quality associated with the future climate include: higher temperature, less convection and lower mixing depth as well as higher natural emissions. Reductions of anthropogenic emissions can significantly mitigate the “climate penalty” for ozone air quality, and even turn it into a “climate benefit”. The 2000-2050 climate change would reduce the PRB ozone in U.S. by 1-3 ppb for most areas while the changes in global anthropogenic emissions would increase the PRB ozone in U.S. by 2-5 ppb.
Effects of climate change on global ozone Increase of ozone in the upper tropical troposphere due to increase of lightning Annual zonal mean ozone Surface afternoon ozone (JJA)
Changes of OH Surface - summer Global – zonal - annual
Changes of CO Surface - July Global – zonal - annual