Download
1 / 24
240 likes | 581 Vues
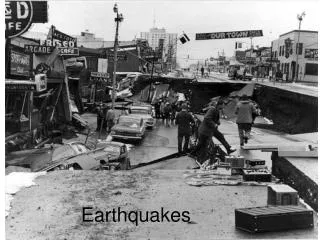
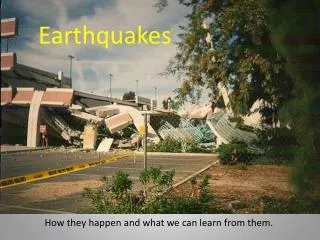
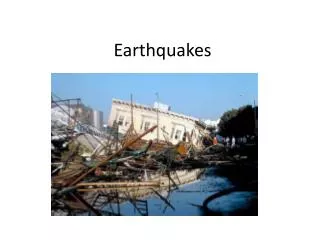
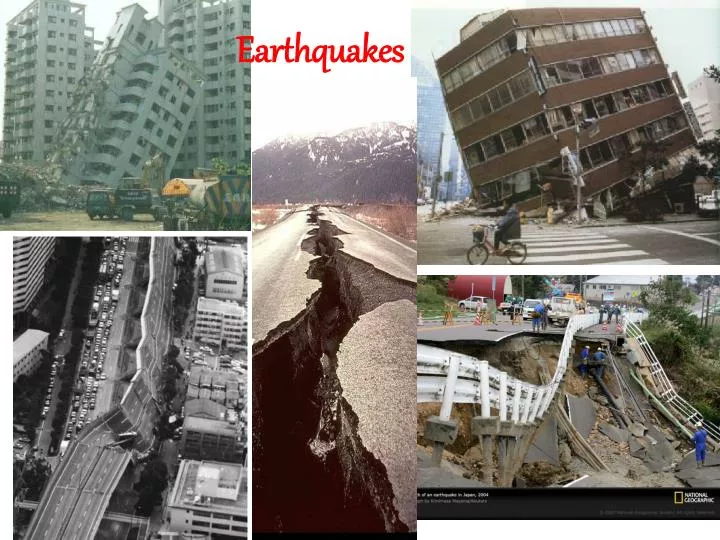
Earthquakes. How do scientists measure Earthquakes? An Earthquake is: a sudden movement called a tremor in the Earth’s Crust. It is caused by the release of pressure which causes shock (or seismic ) waves We are going to investigate : how scientists measure these seismic waves.

E N D
How do scientists measure Earthquakes? • An Earthquake is: • a sudden movement called a tremor in the Earth’s Crust. • It is caused by the release of pressure which causes shock (or seismic ) waves • We are going to investigate : • how scientists measure these seismic waves. • How scientists make sense of the results they obtain • How do scientists locate where an Earthquake is coming from (its epicentre). • How scientists can work out which way a tectonic plate is moving.
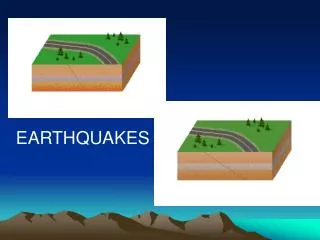
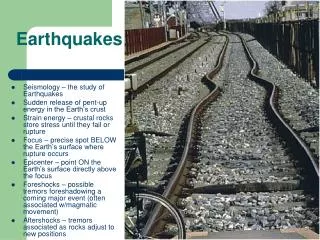
What causes Earthquakes? We have a model to show you how these Tectonic plates move- it’s a bit like huge glaciers floating around each other in a very crowded sea. As two plates slide against each other it is not a smooth action- they push against each other then suddenly slip. This causes shock waves like a drop of water falling into a puddle. Tectonic plates slide past each other – this is not smooth Shock waves Radiate like rings in a puddle becoming less strong as they get further away
How do we measure Earthquakes? Seismometers ( or seismographs) rely on inertia of a large weight- in the picture this weight is suspended by a spring. As the ground moves due to the Earthquake so the drum moves in relation to the weight (and the pencil attached to it). The spring amplifies the movement so that it can be recorded on the chart attached to the revolving drum. The chart is called a seismogram
The main types of waves produced by an Earthquake Lets use a slinky to show you what they are like…… These two types of wave move at different speeds. Use your slinkies to decide which wave moves the fastest. Longitudinal or P wave Transverse or S wave
How seismic waves travel around and through the Earth. P waves are the only seismic waves that can travel through the liquid outer core. They are the fastest waves S waves travel through the mantle and Earth’s crust. They are slower than P waves and cannot travel through fluids Surface waves are slower than P and S waves.
Locating the centre of an Earthquake. Scientists use the fact that P and S waves move at different speeds to help them to determine where an Earthquake is coming from. They have theoretical models of travel times for different types of waves. P wave S Wave
The Seismogram is then placed on the Travel-time curve. Looking down to the x axis gives the distance between the Earthquake and the Station. What is the distance for this seismogram?
Locating an Earthquake The time interval between P and S wave needs to be measured at 3 or more different stations Station 1 Station 2 Station 3
Locating an Earthquake Second thing to do: Make circles of radius distance from shock wave Where they intersect is the centre of the Earthquake station3 Station 1 Station 2
Activity Working in groups of 4. We would like you to use some seismograms to work out how far away the Earthquake epicentre is from your Station. We will then combine this information to work out where the epicentre is.
In which direction is the Plate moving? Using the box and slinkies I’d like you to do an investigation. The box represents a Tectonic Plate and the slinkies represent the seismic waves. Make sure you hold the slinkies so that they are the same length and the coils are evenly spaced. what happens when you hit the box? Look carefully at the slinkies. Hit the box
In which direction is the Plate moving ? What did you notice? What you have seen is a compression pulse and an expansion pulse. Compression and expansion pulses show up differently on seismograms: Look closely at the first trace does it go up or down?
Results JCC station should have found : A distance of roughly 460km and an extensional motion.
Results PACP station should have found : A distance of roughly 40km and an extensional motion.
Results SAO station should have found : A distance of roughly 40km and a compressive motion.
Results CMB station should have found : A distance of roughly 160km and a compressive motion.
Results ORV station should have found : A distance of roughly 280km and a compressive motion.
Results KCC station should have found : A distance of roughly 210km and compressive motion.
Results FARB station should have found : A distance of roughly 130km and a compressive motion.
Results RAMR station should have found : A distance of roughly 170km and a compressive motion.
Summary So, in summary we find that motion on the fault has caused the east block to move Southwards and the west block to Move Northwards. This is consistent with the plate movements of the region.