Download
1 / 64
660 likes | 898 Vues
Simulation of Sediment Transport due to Dam Removal and Control of Morphological Changes. Yan Ding* and Eddy Langendoen** * National Center for Computational Hydroscience and Engineering, The University of Mississippi, University, MS 38677, U.S.A.

E N D
Simulation of Sediment Transport due to Dam Removal and Control of Morphological Changes Yan Ding* and Eddy Langendoen** * National Center for Computational Hydroscience and Engineering, The University of Mississippi, University, MS 38677, U.S.A. **Channel and Watershed Processes Research Unit USDA Agricultural Research Service National Sedimentation Laboratory, Oxford, MS 38655, U.S.A.
Outline Introduction Numerical Simulation of Post Dam Removal Sediment Dynamics Along the Kalamazoo River Between Otsego and Plainwell, Michigan Numerical Simulation of Morphological Changes due to Marmot Dam Removal in Sandy River, Oregon Preliminary Study on Optimal Control of Sediment Release in the Dam Removal Process Concluding Remarks
Dam Removal Impact and River Restoration Financial issue : Operating and maintenance costs outweigh the benefits - including hydropower, flood control, irrigation, or recreation, Functional issue: where the dam no longer serves any useful purpose, Ecological issues: restoring flows for fish and wildlife, reinstating the natural sediment and nutrient flow, Safety issues: eliminating safety risks, Recreational issues: restoring opportunities for recreation. The impacts of removal have been addressed by different studies. Generally they can be divided into main categories. (1) Short-Term Ecological Impacts of Dam Removal Sediment Release, Increased Sediment Concentration and Contaminated Sediment, and (2) Long-Term Impacts of Dam Removal (Flow change regimes, temperature, sediment transport and water quality)
Case Study: Numerical Simulation of Post Dam Removal Sediment Dynamics Along the Kalamazoo River Between Otsego and Plainwell, Michigan
DA: 2,020 sq mi Relief: 686 ft
Background • Otsego City Dam • Built in 1840s to create freight business • Papermill was constructed in 1880s and remains in operation • Repaired and rebuild over time • 151 ft x 13 ft • Plainwell Dam • Built around 1900 to provide power • Power generators decommissioned in mid 1960s • Superstructure and part of spillway removed in mid 1980s • 172 ft x 14 ft
Background (cont.) • PCB contaminated sediments deposited in the dam impoundments • Banks: 5 mg/kg – 82 mg/kg • Floodplain: 3 mg/kg – 84 mg/kg • MDNR interested in removing the dams • MDEQ and EPA interested in understanding present condition and potential concerns (bank erosion)
Summary of Studies • LimnoTech • KALSIM: HEC6, Bank erosion based on Osman & Thorne (1988), PCB fate model • USGS • Survey transects, flow velocity, instream sediments • SEDMOD (Bennett) • Channel restoration design • NSL • Identify streambank erosion problems: static model (USGS) and dynamic model (NSL) • Collect streambank material properties: erodibility and shear strength
Impoundment Area: 3,290,000 sq ft Volume of deposit: 457,000 cu yd (56% main-stem channel)
Impoundment Area: 701,000 sq ft Volume of deposit: 77,600 cu yd
Modeling Scenarios • Dams In (no change, DI) • Dams Out (DO) • Design (D) • 38-year long discharge time series constructed from 1984-2003 period of record • Simulation period: 2000-2037
Output: Changes in channel geometry Time series of hydraulic variables and sediment yield Input: Channel geometry Composition of bed and bank materials Erosion resistance and shear strength of bed and bank materials Rates of flow and sediments entering the channel Bendway weir Bed evolution and sediment transport Streambank erosion Flow hydraulics CONCEPTS – CONservational Channel Evolution and Pollutant Transport System CONCEPTS simulates long-term response of channels to loadings of water and sediments, and to instream structures
BST – shear strength Jet test – erodibility
11% 6% 108% 5% 77% 8% 9% 90% 11% 74% 1% 12% 17% 84% 99% 4% 10% 95% 5% 6%
Simulated Bed Adjustment • Dams Out Scenario Plainwell Dam Otsego City Dam
Remobilization & transport Deposition Upstream migration Rapid incision Simulated Bed Adjustment (cont.) • Dams Out Scenario
Followed by widening Narrowing Simulated Top Width Adjustment • Dams Out Scenario
G1 G2
G5 G6
P17 G1
POC6 POC4
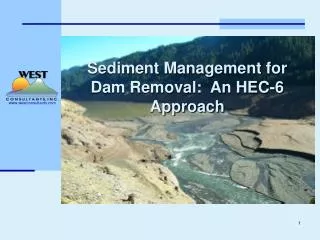
Case Study: Numerical Simulation of Morphological Changes due to Marmot Dam Removal in Sandy River, Oregon Objective of control in this case: Validation of sediment transport model Minimize the morphological changes (erosion and deposition) at downstream by diverting extra sediments from the reservoir (dredging?)
Marmot Dam Removal in the Sandy River, Oregon http://www.youtube.com/watch?v=i1NI2ia3nDw
Rainfall-Runoff Simulation Upland Soil Erosion (AGNPS or SWAT) Channel Network and Sub-basin Definition (TOPAZ) Digital Elevation Model (DEM) Channel Network Flow and Sediment Routing (CCHE1D) Integrated Watershed & Channel Network Modeling with CCHE1D Principal Features Dynamic Wave Model for Flood Wave Prediction • Hydrodynamic Modeling in Channel Network • Non-uniform Total-Load Transport • Non-equilibrium Transport Model • Coupled Sediment Transport Equations Solution • Bank Erosion and Mass Failure • Several Methods for Determination of Sediment-Related Parameters where Q = discharge; Z=water stage; A=Cross-sectional Area; q=Lateral outflow; =correction factor; R=hydraulic radius n = Manning’s roughness • Boundary Conditions • Initial Conditions (Base Flows) • Internal Flow Conditions for Channel Network
CCHE1D Sediment Transport Model Principal Features Non-equilibrium transport of non-uniform sediments • Non-uniform Total-Load Transport • Non-equilibrium SedTran Model • Coupled SedTran Equations Solution (Direct Solution Technique) • Bank Erosion and Mass Failure • Several Methods for Determination of Sediment-Related Parameters A=cross-section area; Ctk=section-averaged sediment concentration of size class k; Qtk=actual sediment transport rate; Qt*k=sediment transport capacity; Ls=adaptation length andQlk= lateral inflow or outflow sediment discharge per unit channel length; Ut=section averaged velocity of sediment
Sandy River Longitudinal Profiles Computational Reach Major J. J. et al (2012), USGS Technical Report, http://pubs.usgs.gov/pp/1792/
Reservoir Sediment Property Reservoir deposition profile (Source: PGE photogrametry, 1999) Reservoir sediment size composition (Stillwater Science, 1999)
Boundary Conditions for Model Validation Simulation Period 10/19/2007 – 09/30/2008 Downstream Water Depth Hydrograph Upstream Discharge Hydrograph