Download
1 / 32
320 likes | 546 Vues
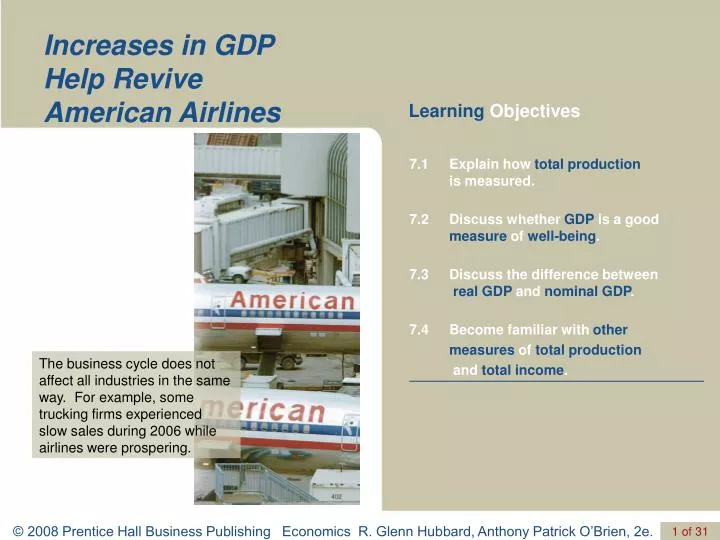
Increases in GDP Help Revive American Airlines. Learning Objectives. The business cycle does not affect all industries in the same way. For example, some trucking firms experienced slow sales during 2006 while airlines were prospering. GDP: Measuring Total Production and Income.

E N D
Increases in GDP Help Revive American Airlines Learning Objectives The business cycle does not affect all industries in the same way. For example, some trucking firms experienced slow sales during 2006 while airlines were prospering.
GDP: Measuring Total Production and Income Microeconomics The study of how households and firms make choices, how they interact in markets, and how the government attempts to influence their choices. Macroeconomics The study of the economy as a whole, including topics such as inflation, unemployment, and economic growth. Business cycle Alternating periods of economic expansion and economic recession.
GDP: Measuring Total Production and Income Expansion The period of a business cycle during which total production and total employment are increasing. RecessionThe period of a business cycle during which total production and total employment are decreasing. Economic growth The ability of an economy to produce increasing quantities of goods and services. Inflation rateThe percentage increase in the price level from one year to the next.
Learning Objective 7.1 Gross Domestic Product Measures Total Production Measuring Total Production: Gross Domestic Product Gross domestic product (GDP) The market value of all final goods and services produced in a country during a period of time, typically one year. GDP Is Measured Using Market Values, Not Quantities The word value is important in the definition of GDP: We want dollar value!
Learning Objective 7.1 Gross Domestic Product Measures Total Production GDP Includes Only the Market Value of Final Goods Final good or service A good or service purchased by afinal user. Intermediate good or service A good or service that is an input into another good or service, such as a tire on a truck. • GDP Includes Only Current Production:GDP includes only production that takes place during the indicated time period. • Only goods and services produced within the year (not sold in that year) • Only production within the geographic boundaries of the United States.
Measuring Total Production: Gross Domestic Product GDP = sum of the money values of all final goods and services produced in the domestic economy within a specified period of time. (such as a year). Suppose in country A there are a total of n goods and services produced; then in year t: Nominal GDPt = P1,t *Q 1,t + P 2,t *Q 2,t + … + Pn,t *Q n,t Nominal GDP may change if prices change and the quantities are constant.
Learning Objective 7.1 7-1 Solved Problem Calculating GDP
How to calculate GDP? • Expenditure Approach • Income Approach • Value Added Approach
Learning Objective 7.1 Expenditure Approach: GDP as the Sum of Final Goods and Services C:Personal Consumption Expenditures, or “Consumption” Consumption Spending by households on goods and services, not including spending on new houses. I: Gross Private Domestic Investment, or “Investment” Investment Spending by firms on new factories, office buildings, machinery, and additions to inventories, and spending by households on new houses. Don’t Let This Happen to YOU!Remember What Economists Mean by Investment
Learning Objective 7.1 Expenditure Approach: GDP as the Sum of Final Goods and Services G: Government Consumption and Gross Investment, or “Government Purchases” Government purchasesSpending by federal, state, and local governments on goods and services. (X-IM) or NX: Net Exports of Goods and Services, or “Net Exports” (X-IM): Net exports Exports minus imports.
Learning Objective 7.1 Expenditure Approach: GDP as the Sum of Final Goods and Services Some Actual Values FIGURE 7-2 Components of GDP in 2006
Learning Objective 7.1 Expenditure Approach: GDP as the Sum of Final Goods and Services Some Actual Values • • Consumer spending on services is greater than the sum of spending on durable and nondurable goods. • • Business fixed investment is the largest component of investment. • Purchases made by state and local governments are greater than purchases made by the federal government. • Imports are greater than exports, so net exports are negative.
Learning Objective 7.1 VA Approach: GDP as the Sum of Values Added • GDP = sum of values added to goods in all firms • Value added = firm’s revenue from selling a product minus the amount paid for goods and services purchased from other firms Table 7-1 Calculating Value Added
Income Approach: GDP as the Sum of All Income • The income approach to measuring GDP is to add up all the income earned by households and firms in a single year. • The rationale behind the income approach is that total expenditures on final goods and services are eventually received by households and firms in the form of wage, profit, rent, and interest income. • Therefore, by adding together wage, profit, rent, and interest income, one should obtain the same value of GDP as is obtained using the expenditure approach. • GDP = wages + interest + rents + profits + statistical adjustment
Learning Objective 7.4 Income Approach: GDP as the Sum of All Income The Division of Income: Total: $13,247 bil. FIGURE 7-5 The Division of Income
Other Measures of Total Production and Total Income • Gross National Product (GNP) • is the total income acquired by Americans both within the U.S. and elsewhere. • includes foreign production by U.S. firms but excludes U.S. production by foreign firms. • GNP= GDP + net foreign factor income • National Income = GNP – depreciation – indirect business taxes
Net foreign factor income Depreciation Net exports Indirect business taxes Government expenditures Rents Interest Investment Profits GNP GDP National Income Consumption Employee compensation Income-expenditure identity: Expenditure = Income Y=C+I+G+NX (1) Expenditures (2) Output (3) Income = =
Learning Objective 7.2 Does GDP Measure What We Want It to Measure? Shortcomings in GDP as a Measure of Total Production Household Production Household production refers to goods and services people produce for themselves. The Underground Economy Underground economy Buying and selling of goods and services that is concealed from the government to avoid taxes or regulations or because the goods and services are illegal.
Learning Objective 7.2 Does GDP Measure What We Want It to Measure? Shortcomings of GDP as a Measure of Well-Being The Value of Leisure Is Not Included in GDP GDP Is Not Adjusted for Pollution or Other Negative Effects of Production GDP Is Not Adjusted for Changes in Crime and Other Social Problems GDP Measures the Size of the Pie but Not How the Pie Is Divided Up
Learning Objective 7.2 MakingtheConnection Did World War II Bring Prosperity?
Trucking Industry Depends on the Goods—Not Services—Component of GDP LOOK An Inside Economic Slowdown Slams Breaks on Trucking Sector As goods decline as a percentage of GDP, so does the demand for ground-freight transportation services. (The goods and services shares of GDP do not sum to 100 percent because GDP is composed of goods, services, and structures.)
Learning Objective 7.3 Real GDP versus Nominal GDP Calculating Real GDP Real GDP The value of final goods and services evaluated at base-year prices. Nominal GDP The value of final goods and services evaluated at current-year prices.
Learning Objective 7.3 7-3 Solved Problem Calculating Real GDP
Learning Objective 7.3 Real GDP versus Nominal GDP Comparing Real GDP and Nominal GDP FIGURE 7-3 Nominal GDP and Real GDP, 1990–2006
Learning Objective 7.3 Real GDP versus Nominal GDP The GDP Deflator Price level A measure of the average prices of goods and services in the economy. GDP deflator A measure of the price level, calculated by dividing nominal GDP by real GDP and multiplying by 100.
Learning Objective 7.3 Real GDP versus Nominal GDP The GDP Deflator
Learning Objective 7.3 Real GDP versus Nominal GDP Growth Rate of Nominal GDP and Real GDP Growth rate of GDP from year t to t+1: Nominal GDP: Real GDP