Download
1 / 21
210 likes | 211 Vues
Discover the changing landscape of TV content consumption and consumer preferences in TV bundles. Find out which networks and services are considered essential and which bundling models attract more consumers.

E N D
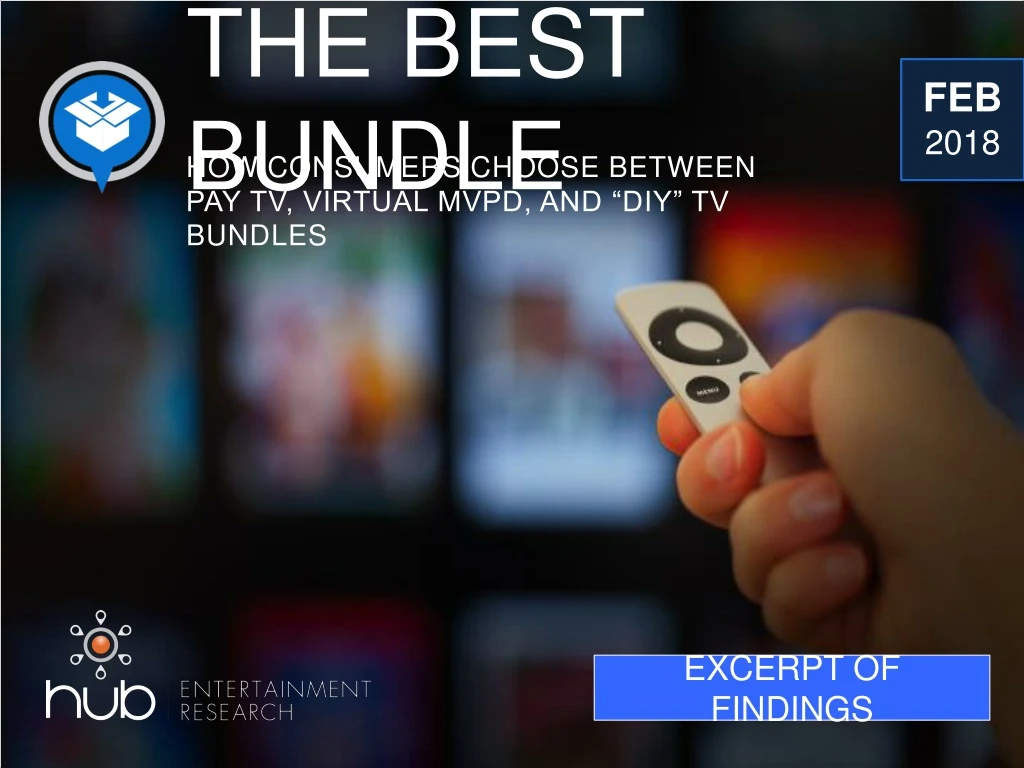
THE BEST BUNDLE FEB 2018 HOW CONSUMERS CHOOSE BETWEEN PAY TV, VIRTUAL MVPD, AND “DIY” TV BUNDLES EXCERPT OF FINDINGS
2017 saw some of the largest increases in consumer choice when it comes to TV content More content: Scripted TV series hit a new high in 2017 Online originals were up 680% since 2012 More providers: Hulu with Live TV and YouTube TV launched More change on horizon: DTC offerings from Disney, ESPN Content from Apple
But there’s evidence the pendulum of consumer preference is swinging back towards aggregation Viewers say the number of shows is difficult to navigate Many say they won’t add new subscriptions without eliminating some Positive response to aggregation by pay TV operators E.g. Comcast integrating Netflix into VOD
IN THIS ENVIRONMENT: WHAT’S THE MOST EFFECTIVE APPROACH TO BUNDLING?
In this study, we measure how consumers approach meeting their needs for TV content What is the perceived value of pay TV bundles, VMVPDs, and “DIY” bundles of standalones? BUNDLE VS. STANDALONE Which networks or SVOD services do consumers consider to be “must haves” in their bundle? CONTENT PRIORITIES TRACK CHANGES How have awareness and appeal of different bundling options changed over the past year? MEASURE APPEAL How excited are consumers about new players entering the market (e.g. Disney, Apple, etc.)? PREDICT OPPORTUNITIES Which models for delivering content will attract more consumers in the future, and which providers are best positioned to deliver?
We surveyed 2,056consumers in the U.S. • Ages 16 to 74 • Watch at least 1 hour of TV per week • Have broadband at home • U.S. census balanced • Data collection completed in February 2018
There’s still no “magic bullet”: the most satisfied viewers use multiple TV subscriptions % “MY TV NEEDS ARE VERY WELL MET” # of TV subscriptions 62% 51% 47% 40%
We asked a series of questions on consumers’ perceptions about the number of different services available today In each question, we asked them to use a slider to indicate their position in relation to two opposing alternatives OPTION A OPTION B The slider captures their rating on each question on a zero-to-10 scale
Reading the results: Blue circle = slider in position 8-10 Red circle = slider in position 0-2 XX% YY% OPTION A OPTION B
Consumers are more likely to feel positive than negative about the growth in available TV platforms HOW DO YOU FEEL ABOUT THE GROWTH IN THE NUMBER OF DIFFERENT TV SOURCES TO CHOOSE FROM? Negative feeling about growth in TV sources Positive feeling about growth in TV sources 2017: 46% 29% 7% FEEL NEGATIVE ABOUT GROWTH OF TV SOURCES FEEL POSITIVE ABOUT GROWTH OF TV SOURCES Q7a Use the slider below to tell us how you feel about the growth in the number of different sources for accessing TV content.
...but there‘s been a big drop in positivity since a year ago HOW DO YOU FEEL ABOUT THE GROWTH IN THE NUMBER OF DIFFERENT TV SOURCES TO CHOOSE FROM? Positive feeling about growth in TV sources 2018 2017 46% 29% FEEL NEGATIVE ABOUT GROWTH OF TV SOURCES FEEL POSITIVE ABOUT GROWTH OF TV SOURCES Q7a Use the slider below to tell us how you feel about the growth in the number of different sources for accessing TV content.
Faced with overload, viewers crave simplicity: an aggregated service, with just the networks they want WHICH TYPE OF SERVICE DO YOU PREFER? Respondents overwhelmingly prefer bundles that let them choose, and pay for, only their favorite networks
Only one-fifth of respondents are very clear on how the various options for TV service today are different from each other... HOW CLEAR ARE YOU ON THE DIFFERENCES BETWEEN TV SOURCES AVAILABLE TODAY? …no idea about differences between TV services …very clear idea of differences between TV services 21% 9% NO IDEA HOW TV SERVICES DIFFER CLEAR IDEA HOW TV SERVICES DIFFER Q7b And use the slider below to tell us which statement comes closer to how you feel about the differences between TV services.
...and again, there has been a big drop from last year (when about one-third felt the differences were clear) HOW CLEAR ARE YOU ON THE DIFFERENCES BETWEEN TV SOURCES AVAILABLE TODAY? …very clear idea of differences between TV services 2017 31% 2018 21% Q7b And use the slider below to tell us which statement comes closer to how you feel about the differences between TV services.
When it comes to bundles, less is becoming more: …that puts together a package of networks that offers the most value to consumers …that lets me choose and pay for only the individual networks I want to include 10% 43% PREFER TO CHOOSE NETWORKS INDIVIDUALLY PREFER PACKAGE WITH GREATEST VALUE
TV consumers build smaller bundles of sources they care about – even when they could add more Even when given a long list of brands, and told to choose as many as they like (with no price considerations)… 78
TV consumers build smaller bundles of sources they care about – even when they could add more Even when given a long list of brands, and told to choose as many as they like (with no price considerations)… …the average viewer created a bundle with only about 20% of the possible choices included 78
JON GIEGENGACK PRINCIPAL HUB ENTERTAINMENT RESEARCH (603) 661-0068 jong@hubresearchllc.com