Download
1 / 20
200 likes | 276 Vues
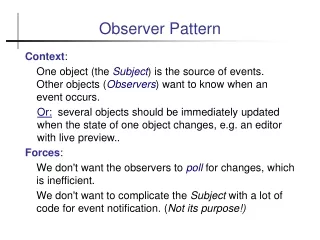
Observer Performance Using Monitors With Different Phosphors. Elizabeth A. Krupinski, PhD Hans Roehrig, PhD University of Arizona Tucson, AZ. P104 vs P45. P104 bigger grain size fewer grains per pixel two components more non-uniformity Lower SNR for P104 . Examples.

E N D
Observer Performance Using Monitors With Different Phosphors Elizabeth A. Krupinski, PhD Hans Roehrig, PhD University of Arizona Tucson, AZ
P104 vs P45 • P104 • bigger grain size • fewer grains per pixel • two components • more non-uniformity • Lower SNR for P104
Examples P45 Phosphor P104 Phosphor
l e x i P - T R C / R N S Max SNR / CRT Pixel 120 P45 Phosphor 80 . P 104 Phosphor 40 0 0 20 40 60 80 Luminance (cd/m2)
(cd/m2) e c n a n i m u L Display Function 200.00 160.00 120.00 P104 P45 80.00 40.00 0.00 0.00 100.00 200.00 300.00 Command Level (ADU)
Veiling Glare 0.020 0.016 0.012 Veiling glare ratio P45 0.008 0.004 P104 0 0 200 400 600 800 1000 Disk Diameter in # of Pixels
y t i s n e t n I d e t t i m E l e x i P Pixel Emitted intensity 1.2 1.0 P45 0.8 P104 0.6 0.4 0.2 0 2 4 6 8 10 # Pixels in Pixel String
TF M 0.0 0.5 1.0 1.5 2.0 2.5 0.0 0.5 1.0 1.5 2.0 2.5 MTF P45 P104 1.2 1.2 113 ADU 113 ADU 0.8 0.8 Vertical MTF - Vertical MTF 200 ADU 200 ADU 0.4 0.4 113 ADU 113 ADU Horizontal MTF Horizontal MTF 200 ADU 200 ADU 0.0 0.0 Frequency(lp/mm)
JND Performance F = 28.55 df = 23 p < 0.0001
Methods & Materials • 20 chest images • 5 lesion free • 15 solitary pulmonary nodule • Image Systems P45 & P104 monitors • 1600 x 1200 resolution • Pixel size = 0.245 mm • 6 radiologists as observers
Images - Conventional radiographs 150 mA 125 kVp - CT confirmation - Digitized with VIDAR VXR - 2100 x 2552 x 16-bits
Viewing Conditions • Eye-position recorded • ASL 4000 SU with head-tracker • < 1 deg accuracy • Ambient lights off • No time restrictions • ~ 2 weeks between sessions
ROC Az Results • Mean Az : P45 = 0.9235 P104 = 0.8851 • ANOVA • Treatment : F = 0.4516, p = 0.5097 • Cases : F = 0.4038, p = 0.9864 • Readers : F = 0.1548, p = 0.9781 • No significant interaction effects
Eye-Position Results* • Mean Viewing Times Overall - P45 = 22.36 seconds - P104 = 27.41 seconds * ~ 75% of the data. Future will split out lesion vs lesion-free images & residents vs radiologists
Eye-Position Results • Median Dwell Times x Decision (msec) P45 P104 TP = 2043 < 2237 FN = 1528 > 1411 FP = 1986 < 1958 TN = 470 < 513
Eye-Position Results • Mean Time to First “Hit” nodules (msec) P45 P104 TP = 312 < 369 FN = 563 < 602
Conclusions • Phosphor may not affectdiagnostic accuracy • May affectsearch parameters • Might influence purchase & clinical use choices
Caveats • Detection not classification • Pulmonary nodules only • No image processing (window / level) allowed • Task & stimuli may influence results • Further studies should be done