Download
1 / 1
10 likes | 107 Vues
Italy has established a national network for background CO2 measurement across three remote stations, ensuring unified data collection, calibration, and comparison. The collaboration among CESI, ENEA, and the Italian Air Force Meteorological Service aims to enhance measurement accuracy, methodology, and intercalibration, crucial for regional and global carbon budget evaluation.

E N D
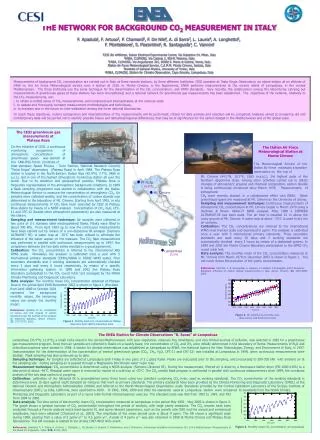
THE NETWORK FOR BACKGROUND CO2 MEASUREMENT IN ITALY F. Apadula1, F. Artuso2, P. Chamard3, F. De Nile4, A. di Sarra3, L. Lauria4, A. Longhetto5, F. Monteleone2, S. Piacentino6, R. Santaguida4, C. Vannini1 1CESI BU AMBiente, Italian Electrical Experimental Center, Via Rubattino 54, Milan, Italy 2ENEA, CLIM-OSS, Via Catania 2, 90141 Palermo, Italy 3ENEA, CLIM-OSS, Via Anguillarese 301, 00060 S. Maria di Galeria, Roma, Italy 4Italian Air Force Meteorological Service, C.A.M.M. Monte Cimone, Sestola, Italy 5Institute of General Physics, University of Torino, Italy 6ENEA, CLIM-OSS, Station for Climate Observation, Capo Grecale, Lampedusa, Italy Measurements of background CO2 concentration are carried out in Italy at three remote stations, by three different Institutes: CESI operates at Testa Grigia Observatory, an alpine station at an altitude of 3480 m; the Air Force Meteorological service runs a station at 2165 m, Monte Cimone, in the Appennines; ENEA performs measurements at the remote island of Lampedusa, in the central Mediterranean. The three Institutes use the same technique for the determination of the CO2 concentration, and WMO standards. Very recently, the collaboration among the laboratories carrying out measurements of greenhouse gases at these stations has been strengthened, and a national network for greenhouse gas measurements has been established. The objectives of the network, relatively to the CO2 measurements, are: i. to obtain a unified series of CO2 measurements, well compared and intercalibrated, at the national scale; ii. to update and thoroughly compare measurement methodologies and techniques; iii. to maintain also in the future an inter-calibration among the three national laboratories. To reach these objectives, routine comparisons and intercalibrations of the measurements will be performed; criteria for data analysis and selection will be compared; analyses aimed at comparing old and contemporary data will be carried out to identify possible biases and latitudinal/regional differences, that may be of significance for the carbon budget in the Mediterranean and at the global scale. The CESI greenhouse gas measurements at Plateau Rosa On the initiative of CESI, a continuous monitoring programme of atmospheric concentration of greenhouse gases was started at the CNR-IFSI-Torino (Institute of The Italian Air Force Meteorological Station at Monte Cimone The Meteorological Service of the Italian Air Force maintains a baseline observatory on the top of Inter-planetary Space Physics - Turin Section, National Research Council) “Testa Grigia” observatory (Plateau Rosa) in April 1989. The Plateau Rosa station is located in the North-Eastern Italian Alps (45.9°N, 7.7°E, 3480 m a.s.l.), and is one of the highest atmospheric monitoring station all over the world.Due to its elevation and geographical position, Plateau Rosa is frequently representative of the atmospheric background conditions. In 1989 a flask sampling programme was started in collaboration with the Italian Meteorological Service to measure the concentration of atmospheric CO2. Air samples were collected weekly, and the concentration of carbon dioxide was determined at the laboratory of Mt. Cimone. Starting from April 1993, in situ continuous measurements of CO2 have been executed by CESI at Plateau Rosa station by means of a NDIR analyser. Concentration of CH4, N2O, CFC-11 and CFC-12 (beside other atmospheric parameters) are also measured at the station. Sampling and measurement technique: Air samples were collected in two pairs of 2-L stainless steel electropolished flasks. Flasks were filled to about 300 kPa. From April 1993 up to now the continuous measurements have been carried out by means of a non-dispersive IR analyser (Siemens ULTRAMAT 5E). A water trap at –70°C has been utilised to eliminate the influence of the water vapour on the measure. The CO2 flask measurement was performed in parallel with continuous measurements up to 1997; the comparison between the two data series resulted in a good agreement. Calibration: The CO2 concentration is referred to the international X85 WMO scale. Nowadays the analyser is calibrated once a year with 5 international primary standards (CMDL/NOAA in X2002 WMO scale). Four secondary standards and 2 working standards are automatically checked every 3 days and every 6 hours respectively, by means of a specific information gathering system. In 1999 and 2002 the Plateau Rosa laboratory participated to the CO2 round robin test managed by the NOAA Climate Monitoring and Diagnostic Laboratory. Data analysis: The monthly mean CO2 concentration obtained at Plateau Rosa in the period April 1989-December 2002 is shown in figure 1 (the data Mt. Cimone (44.1°N, 10.7°E, 2165 m.a.s.l.), the highest peak of the Northern Appennine chain. Among other activities carried out to detect changes of atmospheric physical and chemical composition, carbon dioxide is being continuously monitored since March 1979. Measurements of atmospheric CH4 were recently started, in a collaborative effort with ENEA. Other greenhouse gases are measured at Mt. Cimone by the University of Urbino. Sampling and measurement technique: Continuous measurements of atmospheric CO2 concentration at Mt. Cimone began in March 1979 using a Hartman & Brown URAS-2T NDIR analyser. After 1988 a SIEMENS ULTRAMAT-5E has been used. The air inlet is installed 12 m above the rocky ground of Mt. Cimone. A water trap at about –70°C is used to dry the air samples. Calibration: The CO2 concentrations are referred to the international WMO mole fraction scale and expressed in ppmv. The analyser is calibrated once a year with 5 international primary standards. Three secondary standards are used every 20 days and 2 working standards are automatically checked every 3 hours by means of a dedicated system. In 1999 and 2002 the Monte Cimone laboratory participated to the WMO CO2 round robin test. Data analysis: The monthly mean of the CO2 concentration measured at Mt. Cimone from March 1979 to December 2002 is shown in figure 2. The red curve shows the evolution of the yearly concentration. References: Colombo, T., R. Santaguida, A. Capasso, F. Calzolari, F. Evangelisti, and P. Bonasoni, Biospheric influence on carbon dioxide measurements in Italy, Atmos. Environ., 34, 4963-4969, 2000. Pt Rosa 45.9°N Mt Cimone 44.1°N Mediterranean Sea Lampedusa 35.5°N from April 1989 to October 2001 represent the background monthly values, the remaining values are simply the monthly mean). References: Apadula et al., Localization of source and sink regions of carbon dioxide through the method of the synoptic air trajectory statistics, Atmos. Environ., 37, 3757-3770, 2003. Figure 2. Mt. Cimone CO2 monthly mean (blue curve), and trend (red curve). Figure 1. Monthly mean CO2 concentration at Plateau Rosa from April 1989 to December 2002. The ENEA Station for Climate Observations “R. Sarao” at Lampedusa Lampedusa (35.5°N, 12.6°E), a small rocky island in the central Mediterranean, with poor vegetation, relatively few inhabitants, and very limited sources of pollution, was selected in 1992 for a greenhouse gas measurement program. Since then air samples are collected in flasks on a weekly basis; the concentration of CO2 and CH4 were initially determined in the laboratory of Rome. Measurements of N2O and chlorofluorocarbons were started in 1996. A station for climate observations was established at Lampedusa by ENEA, the National Agency for New Technologies, Energy, and Environment of Italy, in 1997. Instrumentation for the determination of the concentration of several greenhouse gases (CO2, CH4, N2O, CFC-11 and CFC-12) was installed at Lampedusa in 1999, when continuous measurements were started. Flask sampling has also continued up to date. Sampling technique: Air samples are collected at Lampedusa each Friday in two pairs of 2 L glass flasks. Flasks are evacuated prior to the sampling, and pressurized to 280-300 kPa with ambient air at the sampling site. During sampling air is passed through a Magnesium Perchlorate water vapor trap. Measurement technique: CO2 concentration is determined using a NDIR analyzer (Siemens Ultramat 5E). During the measurement, filtered air is dried by a Permapure Nafion dryer (PD-1000-24SS) to a dew-point of about -40°C. Residual water vapor is removed by means of a cold trap at -70°C. The CO2 weekly flask program is performed in parallel with continuous measurements since 1999; the combined analysis of the two data series is in progress. Calibration: calibration of the Ultramat 5E is accomplished every three hours using two cylinders containing CO2-in-air, used as working standards. The CO2 concentration of the working standards is determined every 15 days against eight standard air mixtures that work as primary standards. The primary standards have been provided by the Climate Monitoring and Diagnostic Laboratory (CMDL) at the National Oceanic and Atmospheric Administration (NOAA) and referred to the World Meteorological Organization scale. Standards provided by the Central Calibration Laboratory of the Scripps Institute of Oceanography (SIO), La Jolla, California, were used before 2000. In 1992, 1996, 1999 and 2002 the standards used at Lampedusa station were compared to standards from the NOAA Climate Monitoring and Diagnostic Laboratory as part of a round robin-format intercomparison exercise. The standard scale was X85 from 1992 to 1994, and X93 from 1994 to 2000. Data analysis: The time series of the monthly mean CO2 concentration measured at Lampedusa in the period May 1992 - May 2003 is shown in figure 3. The graph shows a general increase of CO2 concentration throughout the period of analysis, with large yearly variations. The CO2 records have been evaluated through a Fourier analysis and a least-squares fit, and some relevant parameters, such as the growth rate (GR) and the annual and semiannual amplitudes, have been obtained [Chamard etal., 2003]. The amplitude of the mean annual cycle is about 9 ppmv. The GR shows a significant peak during 1998, passing from a value of 2 ppmv yr-1 to 4.5 ppmv yr-1. A peak of 4 ppmv yr-1 was also observed in 1998 at Monte Cimone and Plateau Rosa laboratories. This GR increase is related to the strong 1997-98 El Niño event. References: Chamard, P., F. Thiery, A. di Sarra, L. Ciattaglia, L. De Silvestri, P. Grigioni, F. Monteleone, and S. Piacentino, Interannual variability of atmospheric CO2 in the Mediterranean: Measurements at the island of Lampedusa, Tellus, 55B, 83-93, 2003. Figure 3. Monthly mean CO2 concentration at Lampedusa.