Download

1 / 36
390 likes | 724 Vues
The benchmark of perfect competition. Defining perfect competition Modelling market interactions Welfare and efficiency. The benchmark of perfect competition. We have seen : How much consumers choose of a given good, for all levels of price Through consumer choice theory

E N D
The benchmark of perfect competition Defining perfect competition Modelling market interactions Welfare and efficiency
The benchmark of perfect competition • We have seen : • How much consumers choose of a given good, for all levels of price • Through consumer choice theory • How much producers produce of a good, for all levels of price • Through the model of the firm • We now need to work out : • How this supply and demand interact to provide the market price and quantity • We need a model of the market !
The benchmark of perfect competition The interaction of supply and demand The 5 conditions of perfect competition Short run and long run in perfect competition Surplus and welfare
Price 2.50 2.00 1.50 1.00 0.50 Quantity 0 1 2 3 4 5 6 7 8 9 10 11 The interaction of supply and demand Reminder: the demand curve
The interaction of supply and demand • The demand function depends on: • The market price of the good • The income of consumers (BC) • The preferences of consumers (IC) • The price of other goods (S or C) • Expectations (future endowments)
Increase in demand Fall in demand The interaction of supply and demand Price Quantity 0
Price 2.50 2.00 1.50 1.00 0.50 Quantity 0 1 2 3 4 5 6 7 8 9 10 11 The interaction of supply and demand Reminder: the supply curve
The interaction of supply and demand • The supply function depends on: • The market price of the good • The price of inputs (cost function) • Technology (production function) • N˚ of producers • Expectations
Increase in supply Fall in supply The interaction of supply and demand Price Quantity 0
S Equilibrium The interaction of supply and demand Price 3.00 2.50 2.00 1.50 1.00 0.50 D Quantity 0 1 2 3 4 5 6 7 8 9 10 11 12
The interaction of supply and demand Price S 3.00 Excess supply 2.50 2.00 1.50 1.00 0.50 D 0 1 2 3 4 5 6 7 8 9 10 11 12 Quantity
The interaction of supply and demand Price S 2.00 1.50 D Rationing 0 1 2 3 4 5 6 7 8 9 10 11 12 Quantity
2.50 New equilibrium D2 10 3. ... and the amount sold The interaction of supply and demand Price 1. An increase in demand (through exterior cause)… S 2.00 2. ... increases the price ... Initial Equilibrium D1 0 7 Quantity
S2 The interaction of supply and demand Price 1. A fall in supply ... S1 New equilibrium 2.50 2.00 Initial equilibrium 2. ...increases prices... D 4 7 Quantity 3. ...and reduces the quantity sold.
The benchmark of perfect competition The interaction of supply and demand The 5 conditions of perfect competition Short run and long run in perfect competition Surplus and welfare
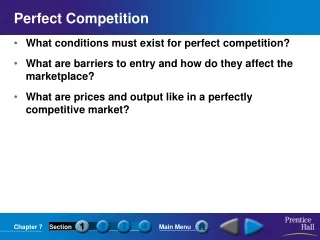
The 5 conditions of perfect competition • Perfect competition is defined by the following 5 conditions: • Large number of agents (Atomicity) • Homogeneous products • Free entry and exit from the market • Perfect information • Perfect mobility of inputs • All 5 are required for an optimal coordination of supply and demand
The 5 conditions of perfect competition • Let’s detail what these conditions imply: • Large number of producers (Atomicity) • There are many producers and consumers • None is large enough to individually influence the market outcome • Homogeneous products • On any given market, the good is exactly the same regardless of who produced it. • Consumers have no preferences w.r.t. producers
The 5 conditions of perfect competition • Free entry and exit from the market • Agents are free to enter and exit markets in response to changing market conditions • There are no barriers to entry or exit • Perfect information • Agents constantly are constantly informed, without delay, of the changing market conditions • Agents also know all perfectly all the characteristics of the goods: No hidden defects, etc.
The 5 conditions of perfect competition • Perfect mobility of inputs • Similar to the “no barriers to entry” condition • Inputs can change markets freely • If even a single one of these conditions fails to hold, then we have imperfect competition • Clearly, this set of conditions is never met in reality !! • But the concept of perfect competition is important as a benchmark for assessing the different kinds of imperfect competition.
The benchmark of perfect competition The interaction of supply and demand The 5 conditions of perfect competition Short run and long run in perfect competition Surplus and welfare
SR and LR in perfect competition • Profit of the firm: • The profit maximisation condition finds output q such that : • What it mR equal to in perfect competition?
SR and LR in perfect competition • Total revenue is simply equal to the quantity sold times the price at which the output is sold: • Marginal revenue is the sum of: • The extra quantity produced ∂q times the price • The effect of the increase on the market price But the atomicity assumption guarantees that this second effect is zero !!!
SR and LR in perfect competition Firm-market equilibrium Firm level Market level Price Price mC Zero profits in equilibrium S AC d=mR p D quantity Quantity Q q
SR and LR in perfect competition Firm-market equilibrium Firm level Market level Price Price mC Imagine a positive demand shock (ex: new “fashion”) Positive profits in SR S AC d2=mR2 p2 d=mR p D2 Total Cost D quantity Quantity Q Q2 q q2
SR and LR in perfect competition Firm-market equilibrium Firm level Market level Price Price Positive profits attract firms to the market (free entry + perfect information) mC Return to zero profits in LR S AC S2 d2=mR2 p2 d=mR p D2 quantity Quantity Q2 Q3 q q2
SR and LR in perfect competition • The significance of zero-profits • Remember that total costs include the opportunity cost • Zero economic profits does not mean zero accounting profits • It means that the accounting profits are equal to the opportunity cost • i.e the reward for producing is “fair” Price mC Zero profits in LR equilibrium AC d=mR p quantity q
SR and LR in perfect competition • Efficiency: • At equilibrium, P=mc=AC • All the increasing returns to scale opportunities are used up, but decreasing returns to scale have not yet appeared • Firms are producing at the most efficient point • Resources are allocated efficiently: the smallest amount of resources possible is allocated to the production Price mC Zero profits in LR equilibrium AC d=mR p quantity q
The benchmark of perfect competition The interaction of supply and demand The 5 conditions of perfect competition Short run and long run in perfect competition Surplus and welfare
Surplus and welfare • What is “surplus” ? • It measures the net benefit to the consumers of purchasing the good... • ...or the netbenefit to the producer of selling the good • It is the difference between: • The reservation price of the agents : the “willingness to pay” for consumers and the marginal cost for producers • The price the good is exchanged on the market.
Surplus and welfare • But how it is worked out ? • Actually, very simply !! • Reminder: the demand function is derived from the utility function (in fact from the indifference curves which map the utility function) • It contains information about preferences, i.e. what a given good/bundle is worth to the consumer in terms of utility • The same is true for the supply curve: • It contains information about the marginal cost of production, i.e. the value of the good under which producers will not produce
Price 2.50 2.00 1.50 1.00 0.50 Quantity 0 1 2 3 4 5 6 7 8 9 10 11 Surplus and welfare Example: Auction vs market 1st unit bought by the most “desperate” consumer: The one willing to pay the most 2nd unit bought by the second most “desperate” consumer: The one willing to pay the most from the remaining agents But on a market, all 8 units are available at p = 1. D
Effect of a fall in price on the surplus of existing consumers Consumer surplus P2 Surplus of new consumers who can now afford the good Q2 Surplus and welfare Consumer surplus P P1 D Q1 Q
Effect of an increase in price on the surplus of existing producers Surplus of new producers who can now supply the good P2 Producer surplus Q2 Surplus and welfare Producer surplus P S P1 Q Q1
Surplus and welfare Global surplus under perfect competition P S P* D Q* Q