Download
1 / 22
230 likes | 834 Vues
Texture Metric Comparison of Manual Forest Stand Delineation and Image Segmentation. Richard M. Warnick, Ken Brewer, Kevin Megown, Mark Finco, and Brian Schwind USDA Forest Service Remote Sensing Applications Center Ralph Warbington USDA Forest Service Pacific Southwest Region

E N D
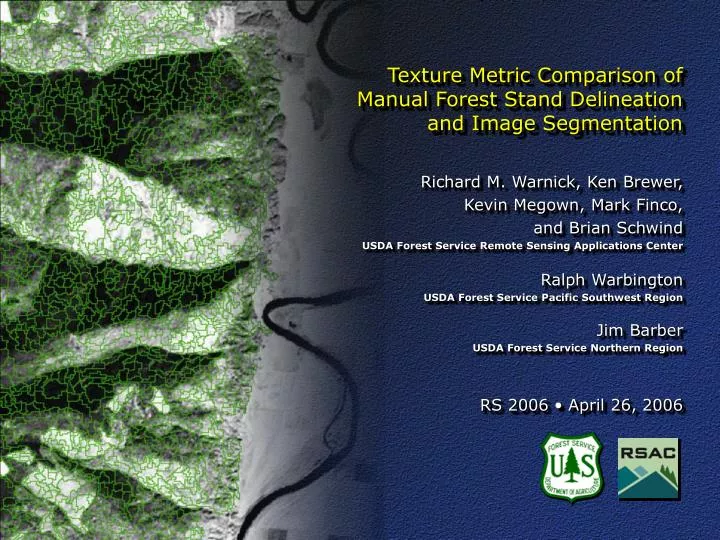
Texture Metric Comparison of Manual Forest Stand Delineation and Image Segmentation Richard M. Warnick, Ken Brewer, Kevin Megown, Mark Finco, and Brian Schwind USDA Forest Service Remote Sensing Applications Center Ralph Warbington USDA Forest Service Pacific Southwest Region Jim Barber USDA Forest Service Northern Region RS 2006 • April 26, 2006
STAND BOUNDARIES IMAGE SEGMENTATION Introduction • Cornerstone assumption: Stand-level forest models work best with homogeneous units • Is there an overall difference in textural homogeneity between manual stand delineation and image segmentation polygons for the same study area?
Introduction • Utilize texture metrics • Gray-Level Co-occurrence Matrix (GLCM) metrics • Correlation • Entropy • Mean • Variance • Compare manual interpretation and image segmentation for forest stand delineation • Vertical stereo photo interpretation • eCognition™ image segmentation from Landsat ETM+
IDAHO Study area Idaho Panhandle National Forests, Idaho/Montana/Washington Study area covers most of Kaniksu NF
Study area Study area Landsat view, Idaho/Montana
GIS datasets • Idaho Panhandle National Forests stand boundaries • Vertical stereo photography (1985 - 1998) • Manual stand delineation (1980s – 1990s) • Northern Region Vegetation Mapping Project • Landsat ETM+ July/August 2002 • Image segmentation using eCognition™
Imagery • Landsat ETM+ panchromatic band (15 m) • 2002 image subset to project area • IRS 1-C panchromatic (5 m) • 1998 image subset to project area • DOQQ mosaic (1 m) • 90 digital ortho quarter quads (1980s-1990s) • NAIP mosaic principal component (1 m) • 2004 National Agricultural Imagery Program color county mosaic subset to project area • First principal component image generated to reduce image to one band
Texture metrics Selection of texture measures • Relatively simple and repeatable • Can be run on commercial software (ENVI®) • Adaptable to corporate software (ERDAS Imagine) • Technique common in remote sensing literature • Need four texture measures, not highly correlated Gray-level Co-occurrence Matrix (GLCM) GLCM texture tutorial by Mryka Hall-Beyer http://www.fp.ucalgary.ca/mhallbey/tutorial.htm
Texture metrics Gray-Level Co-occurrence Matrix texture metrics • GLCM Correlation • Measures the linear dependency of gray levels on those of neighboring pixels in the GLCM • GLCM Entropy • Measures the level of spatial disorder of gray levels in the GLCM • GLCM Mean • Measures the mean of theprobability values from the GLCM • GLCM Variance • Measures the dispersion around the mean of combinations of reference and neighbor pixels in the GLCM
Texture metrics 3 x 3 moving window
Texture metrics Sample window Image pixel DN
Texture metrics GLCM for sample window Neighbor pixel DN Reference pixel DN Distance from the diagonal is proportional to the amount of contrast
MEAN CORRELATION ENTROPY VARIANCE Image processing • ENVI® 4.2 used to generate GLCM texture images • GLCM correlation • GLCM entropy • GLCM mean • GLCM variance
Image processing M – mosaic S – subset PC – principal component T – GLCM texture
5.11 5.77 6.41 5.29 8.00 Zonal statistics
7.51 5.25 5.65 8.77 5.18 5.00 7.51 8.96 6.09 Zonal statistics
Mean = 15.05 Std Dev = 9.945 N = 8,159 Mean = 14.98 Std Dev = 9.769 N = 33,468 Zonal statistics Distribution of zonal means GLCM variance with NAIP STAND POLYGONS SEGMENTATION POLYGONS
Conclusions • Hypotheses • Segmentation polygons would be more homogeneous in texture • Represent existing vegetation instead of management units • Polygons with smaller area are more homogeneous • Texture differences may be minimized • Preliminary findings • Stand and segmentation polygons seem to be almost equally homogeneous, with a slight edge to the latter • Average size of the polygons not reflected in differences in zonal statistics • Stand median acreage = 5.25 • Segmentation median acreage = 2.75
Richard M. Warnick rwarnick@fs.fed.us