Download
1 / 17
170 likes | 304 Vues
Analysis of the Number of Rain Gages Required to Calibrate Radar Rainfall for the Illinois River Basin. Jodi Eshleman. REU sponsor: Dr. Baxter Vieux Dr. Fekadu Moreda Gary Brickley. Introduction.

E N D
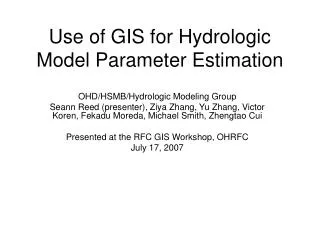
Analysis of the Number of Rain Gages Required to Calibrate Radar Rainfall for the Illinois River Basin Jodi Eshleman REU sponsor: Dr. Baxter Vieux Dr. Fekadu Moreda Gary Brickley Distributed Hydrologic Modeling--Jodi Eshelman
Introduction • Radar rainfall estimates are an important supplement to rain gage accumulations for modeling river basins. • Radar estimates can be biased or in error and must be corrected. Questions: • How many rain gages are necessary to correct the radar? • What degree of accuracy can be achieved? • How do different correction methods compare? Distributed Hydrologic Modeling--Jodi Eshelman
Background • Are 10 gages adequate to calibrate the radar for the Illinois River Basin? • Radar error in estimating rainfall • overshoot cloud tops • Z/R relationship transforms reflectance to rain rate • Correction of radar by applying some correction based on rain gage accumulation • Correcting radar estimates provides more accurate spatial estimates of rainfall for river basin simulation. Distributed Hydrologic Modeling--Jodi Eshelman
2.5° 1.5° 0.5° WSR-88D or NEXRAD • Weather Surveillance Radar-1988 Doppler • Prototyped in Norman at NSSL • Scans Every 5 or 6 minutes during precipitation • 150+ installed in US and abroad Distributed Hydrologic Modeling--Jodi Eshelman
Location of Gages Distributed Hydrologic Modeling--Jodi Eshelman
Presentation Outline • Test 4 different correction factors • Mean field bias • Probability density function • <1mm • Weighted • Gage density study • Size and time progression analysis Distributed Hydrologic Modeling--Jodi Eshelman
Correction Factor Comparison • Adjustment to rain gage mean • Average difference after correction • Simulated discharge volume Distributed Hydrologic Modeling--Jodi Eshelman
PDF is closest to Mesonet Distributed Hydrologic Modeling--Jodi Eshelman
Volume Comparison Distributed Hydrologic Modeling--Jodi Eshelman
Presentation Outline • Test 4 different correction factors • Mean field bias • Probability density function • <1mm • Weighted • Gage density study • Size and time progression analysis Distributed Hydrologic Modeling--Jodi Eshelman
Gage Density Statistically estimating the mean with prescribed accuracy Where: n=number of gages required s2=Variance d=Allowable margin of error (5-30% mean) =% Confidence (60-90%) Distributed Hydrologic Modeling--Jodi Eshelman
Calibration Comparison Distributed Hydrologic Modeling--Jodi Eshelman
Standard Error Approach Distributed Hydrologic Modeling--Jodi Eshelman
Presentation Outline • Test 4 different correction factors • Mean field bias • Probability density function • <1mm • Weighted • Gage density study • Size and time progression analysis Distributed Hydrologic Modeling--Jodi Eshelman
Mean Total Accumulation Distributed Hydrologic Modeling--Jodi Eshelman
Time Progression Distributed Hydrologic Modeling--Jodi Eshelman
Conclusions • PDF correction factor is most effective • Mean adjustment is closer to Mesonet • Average difference is less than MFB • Weighted PDF – • Weighting gages close to the basin improve discharge volume simulations • Gage density study • 10 gages are sufficient for 30% of the mean and 90% confidence • Due to large variance, smallest storms are negligible • little consideration for flooding Distributed Hydrologic Modeling--Jodi Eshelman