Download

1 / 70
710 likes | 873 Vues
Delivering Better Predictability, Business Agility & Governance with Kanban. Executives demand improved agility without sacrificing predictability & governance Bangalore, December 2012. Background. Microsoft 2004 - the XIT Story. Change requests. PTCs. 6. 8. 1. 2. 4. 12. 11. 10. 7.

E N D
Delivering Better Predictability, Business Agility & Governancewith Kanban Executives demand improved agility without sacrificing predictability & governance Bangalore, December 2012
Microsoft 2004 - the XIT Story Change requests PTCs 6 8 1 2 4 12 11 10 7 3 7 6 5 4 3 9 9 1 5 2 PM Product Managers Requests for estimates or analysis of future work are often “invisible”, have an unpredictable arrival rate & are given priority. Testers Developers 1 1 1 Emergency work is unplanned & receives highest priority. Arrival rate & volume are unpredictable. Effect is hugely disruptive! User Acceptance PTCs? What did that acronym mean? Items that did not require coding! Why were they treated as emergencies? Deployment Prioritized Backlog Waiting for Test
Predictability, Agility & Governance So how were they doing on our measures of predictability, agility & governance? PTCs 5 12 11 10 9 7 6 1 4 8 2 7 6 5 3 9 4 3 2 1 Product Managers Testers Developers On-time delivery was 0%. There was a 100% chance of interruption to estimate future work. Planning & prioritization were conducted monthly. Fastest response from receipt to deployment was around 6 weeks. But everything had a business case and was prioritized by ROI! 1 1 1 User Acceptance Deployment So the drive for good governance was destroying predictability and agility! Prioritized Backlog Waiting for Test
What Were the Issues? So what issues affected the outcome? Why were governance policies so disruptive? PTCs 5 12 11 10 9 7 6 1 4 8 2 7 6 5 3 9 4 3 2 1 Product Managers Testers Developers 1 1 1 Product managers demanded fast response on estimates to facilitate future planning and provide fast feedback to business owners. Entire backlog was planned & commitments made early. 90% of the backlog was re-planned each month. Expedite policy for PTCs was folklore – no one could explain why User Acceptance Deployment Process Improvement Conclusion Controlling unplanned, disruptive demand would improve predictability! Prioritized Backlog Waiting for Test
A virtual kanban system was chosen Deploy-ment Ready Engin-eering Ready TestReady ∞ ∞ 5 3 3 5 Testing Backlog UAT Development G F B A E D C G F F F F F F F H Ongoing Done It’s important to realize the process for software development did not change. The kanban system is an overlay on the existing process. It changes scheduling and prioritization only ChangeRequests Pull Pull Pull * PTCs PTCs are permitted to break the kanban limit *Blocked to service PTC I
The Results 240% improvement in delivery rate Backlog depleted. Serving at rate of demand CRs 50 30 10 Time (in quarters) 90% drop in end-to-end cycle time* 125 AverageTime to Resolve 75 25 Time (in quarters) * Includes queuing time prior to selection
Robert Bosch* (2006-2008)IS Website Maintenance Results 78% drop in end-to-end cycle time 40 AverageTime to Create to Resolve 20 10 Time (6 mth intervals) * South Bend, Indiana
State of Virginia, Department of Corrections (2011-2012) 58% drop in end-to-end cycle time 40 AverageTime to Create to Resolve 20 10 Time (3 mth intervals)
Kanban are virtual! Deploy-ment Ready Engin-eering Ready TestReady ∞ 5 3 3 ∞ 5 Testing Backlog UAT Development F A E I D G J H F F F B C F F F Ongoing Done ChangeRequests These are the virtual kanban These are the virtual kanban These are the virtual kanban These are the virtual kanban Pull Pull Boards are not required to do Kanban! The first system used database triggers to signal pull. There was no board! Pull The board is a visualization of the workflow process, the work-in-progress and the (virtual) kanban * PTCs I
Commitment is deferred Deploy-ment Ready Engin-eering Ready TestReady 3 5 5 ∞ ∞ 3 Testing Backlog UAT Development A F H E C G F F F F F F D Ongoing Done Items in the backlog remain optional and unprioritized ChangeRequests Pull Wish to avoid discard after commitment We are committing to getting started. We are certain we want to take delivery. PTCs I Commitment point
Discard rates are often high Deploy-ment Ready Engin-eering Ready TestReady 5 3 5 ∞ ∞ 3 Testing Backlog UAT Development H F F F D E C G A H I F Ongoing Done The discard rate with XIT was 48%. ~50% is commonly observed. Options have value because the future is uncertain 0% discard rate implies there is no uncertainty about the future Deferring commitment and avoiding interrupting workers for estimates makes sense when discard rates are high! ChangeRequests Reject PTCs I Discarded
Specific delivery commitment may be deferred even later Deploy-ment Ready Engin-eering Ready TestReady ∞ 5 3 3 5 ∞ Testing Backlog UAT Development H C E F F F F A F D F G I F Ongoing Done Kanbanuses2 Phase Commit ChangeRequests Pull We are now committing to a specific deployment and delivery date *This may happen earlier if circumstances demand it PTCs I Discarded 2ndCommitmentpoint*
Replenishment Cadence Deploy-ment Ready Engin-eering Ready TestReady 5 ∞ 5 3 3 ∞ Testing Backlog UAT Development Frequent replenishment is more agile. On-demand replenishment is most agile! H A C E F F F F F F D G I F Ongoing Done Replenishment ChangeRequests Pull The frequency of system replenishment should reflect arrival rate of new information and the transaction & coordination costs of holding a meeting PTCs I Discarded
Delivery Cadence Deploy-ment Ready Engin-eering Ready TestReady 5 ∞ 5 3 3 ∞ Testing Backlog UAT Development Frequent deployment is more agile. On-demand deployment is most agile! F C G D E F H F F F F I A F Ongoing Done Delivery ChangeRequests Deployment buffer size can reduce as frequency of delivery increases Pull The frequency of delivery should reflect the transaction & coordination costs of deployment plus costs & tolerance of customer to take delivery PTCs I Discarded
Defining Lead Time Deploy-ment Ready The clock starts ticking when we accept the customers order, not when it is placed! Until then customer orders are merely available options Engin-eering Ready TestReady 5 3 ∞ 5 ∞ 3 Testing Backlog UAT Development F H A C E I F F F F D F G F Ongoing Done Lead time (through the kanban system) ends when the item reaches the first ∞ queue. This provides the correct result for Little’s Law and visualization on a Cumulative Flow Diagram ChangeRequests Pull Lead Time PTCs I Discarded
Little’s Law WIP = Delivery Rate Lead Time Backlog Ready To Deploy Mean Lead Time WIP Mean Delivery Rate
Factors Affecting Agility Kanban decouples replenishment from lead time & delivery enabling tailoring of the process to the dynamics of the business domain The business agility of the system is determined by the replenishment cadence, the delivery cadence and the lead time (or end-to-end cycle time) through the system.
Benefits of Limiting WIP Deploy-ment Ready Engin-eering Ready TestReady 5 3 ∞ 5 ∞ 3 Testing Backlog UAT Development H C E F F F F F F A F G D I Ongoing Done Limiting WIP reduces multi-tasking. Shortens lead time. Focuses organization on impediment removal and limits due date performance degradation from poor quality & rework ChangeRequests Pull Blocked! *Specialist test environment unavailable Bug #* Lead Time PTCs Blocked! Defect found requiring coding fix I Discarded
Observe Lead Time Distribution as an enabler of a Probabilistic Approach to Management This is multi-modal data! The work is of two types: Change Requests (new features); and Production Defects This is multi-modal data! The work is of two types: Change Requests (new features); and Production Defects SLA expectation of105 days with 98 % on-time Mean of 31 days SLA expectation of44 days with 85% on-time
Filter Lead Time data by Type of Work (and Class of Service) to get Single Modal Distributions Production Defects Change Requests 98% at150 days Mean5 days 98% at25 days Mean 50 days 85% at10 days 85% at60 days
Allocate Capacity to Types of Work Deploy-ment Ready Engin-eering Ready 2 5 ∞ 3 3 3 Backlog Development Testing Done AB PB MN GY DE D A I H C G E F Ongoing Done Verification Acceptance ChangeRequests Consistent capacity allocation should bring some consistency to delivery rate of work of each type Consistent capacity allocation should bring more consistency to delivery rate of work of each type Lead Time P1 ProductionDefects Separate understanding ofLead Time for each type of work Separate understanding of Lead Time for each type of work Lead Time
Flow efficiency = Work Time x 100% Lead Time Flow Efficiency Flow efficiency measures the percentage of total lead time that is spent actually adding value (or knowledge) versus waiting Until then customer orders are merely available options Deploy-ment Ready Pool of Ideas Engin-eering Ready 2 3 3 ∞ Testing Development Done AB PB MN GY DE F D H E G A I C Ongoing Done Verification Acceptance Flow efficiencies of 2% have been reported*. 5% -> 15% is normal, > 40% is good! P1 Working Working Lead Time Waiting Waiting Waiting * ZsoltFabok, Lean Agile Scotland, Sep 2012, Lean Kanban France, Oct 2012
Benefits of Reducing Lead Time Deploy-ment Ready Engin-eering Ready TestReady 3 5 ∞ ∞ 3 5 Testing Backlog UAT Development A G H E C F I F F D F F F F Ongoing Done Short lead times enable later commitment, reduce likelihood of post-commitment discard or rework due to perishable nature of information and improve quality as defect insertion rates fall non-linearly with reduced lead time ChangeRequests Pull Bug Bug Bug Short lead time reduces chance of discard Defect insertion rate increases non-linearly with long lead times and low flow efficiency. Defect fix times increase non-linearly with delay time from discovery to fix PTCs I Discarded
More Results (from 2005) Flow efficiency improved from8% to 92% FlowEfficiency (%) 75 These improvements were minimally intrusive, met with little to no resistance (though some managerial derision) and cost almost nothing! 45 15 If it works this well, perhaps we should try this again?!! Time (in quarters) Due DatePerformance DPP improved almost instantly from 0% to 98% against lead time SLA* 75 45 15 Time (in quarters) * Measured from point of commitment
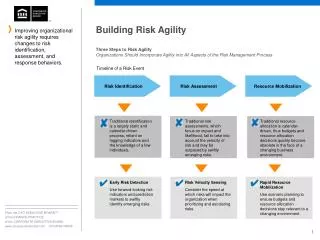
Ability to handle variety and heterogeneity of risks improves business performance Kanban enables us to build a trusted delivery capability. Agility and predictability are tuned to the inherent risks in the business domain! The kanban system explicitly exposes the business risks in terms of types of demand, quantity & rate of demand. It helps us to understand the costs & benefits of frequent interaction with upstream & downstream functions. And it gives us a temporary and quantitative understanding of our capability to deliver against demand
The psychology of a probabilistic approach can be challenging… Change Requests I don’t want to take the risk of being longer than 60 days. I need a precise estimate of when it will be delivered! 98% at150 days Mean 50 days 85% at60 days
Cost of Delay is a critical business risk Expedite – critical and immediate cost of delay; can exceed other kanban limit (bumps other work) impact impact Qualitative approaches to risk management using taxonomies of 2 to 6 categories for each dimension of risk have been shown to fast, cheap & effective in comparison to quantitative methods that often involve speculation and false precision time time • Fixed date – cost of delay goes up significantly after deadline; Start early enough & dynamically prioritize to insure on-time delivery impact impact time time • Standard - cost of delay is shallow but accelerates before leveling out; provide a reasonable lead-time expectation impact impact time time • Intangible – cost of delay may be significant but is not incurred until much later; important but not urgent impact time
Implementing Classes of Service Deploy-ment Ready Engin-eering Ready 3 3 ∞ 2 1 3 1 2 Development Testing Done F G I H A C D E Different distributions for different classes of service increases the level of trust that an item will be delivered in a timely manner, demonstrating that cost of delay is a risk under management Ongoing Done Verification Acceptance Expedite Fixed Date P1 Standard Intangible
The Optimal Exercise Point If we start too early, we forgo the option and opportunity to do something else that may provide value. If we start too late we risk incurring the cost of delay With a 6 in 7 chance of on-time delivery, we can always expedite to insure on-time delivery impact When we need it Ideal Start Here 85th percentile Commitment point
Hedge Delivery Risk by spreading capacity across items of differing urgency Deploy-ment Ready Engin-eering Ready 2 ∞ 3 3 1 3 2 3 Development Testing Done E I A C F H G D Ongoing Done Verification Acceptance Expedite Fixed Date Uncertainty in demand or arrival rate of urgent & critical items is offset with capacity for items that are easily delayed Standard Intangible
Kanban improves risk management Risk is a multidimensional problem. Kanban enables many strategies for managing it, including hedging & aspects of real option theory eg deferred commitment, optimal exercise point decision making; & system liquidity management. Kanban systems should be designed to visualize the true business risks under management. Demand can be classified for multiple risks & analyzed for arrival rate
Cost of Delay has a 2nd Dimension Working capital Extinction Level Event– a short delay will completely deplete the working capital of the business impact time • Major Capital – the cost of delay is such that a major initiative or project will be lost from next year’s portfolio or additional capital will need to be raised to fund it Working capital impact time • Discretionary Spending – departmental budgets may be cut as a result or our business misses its profit forecasts impact time • Intangible – delay causes embarrassment, loss of political capital, affects brand equity, mindshare, customer confidence, etc impact ? time
Market Risk of Change Highlylikely to change Start Late Differentiators Potential Value Spoilers Scheduling Market Risk Regulatory Changes Profits Market Share etc Cost Reducers Table Stakes Start Early Highlyunlikely to change
Aligning with Strategic Position or Go-to-Market Strategy Deploy-ment Ready Engin-eering Ready 2 ∞ 3 1 3 1 2 3 Development Testing Done E I A C F H G D Ongoing Done Verification Acceptance Market segmentation can be used to narrow the necessary table stakes for any given market niche! Enabling early delivery for narrower markets but potentially including value generating differentiating features Table Stakes Cost Reducers Spoilers Differentiators
Product Lifecycle Risk Not well understoodHigh demand for innovation & experimentation Low High Innovative/New Investment Product Risk Major Growth Market ProfitMargin High Cash Cow Low Well understoodLow demand for innovation Low
Hedging Risk in a Portfolio Kanban Horizational position shows percentage complete Allocation of personnel Total = 100% Complete 0% Complete 100% Projects-in-progress Cash Cows 10% budget B A Growth Markets60% budget D C Innovative/New30% budget K E G F H Colormay indicate cost of delay (or other risk)
Visualize Risks to provide Scheduling Information Outside: Start Early Items with the same shape carry the same risks and should be scheduled into the kanban system at approximately the same time. Do not prioritize items. From a group of items with the same risk profile pick whichever ones you like or prefer most Market Risk TS It is also wise to hedge risk by allocating capacity in the system for items of different risk profiles. CR Tech Risk Lifecycle New Spoil Inside: Start Late Mid Unknown Soln Cow Diff Known but not us Done it before Commodity Risk profile for a work item or deliverable Intangible Disc Std FD Maj. Cap. ELE Expedite Cost of Delay Delay Impact
Improving Liquidity through Labor Pool Flexibility Engin-eering Ready Team Lead 2 3 1 3 3 1 3 2 Testing It’s typical to see splits of fixed team workers versus flexible system workers of between 40-60% Roughly half the labor pool are flexible workers Analysis Development Teams PB AB MN GY DE A D F H E C G Ongoing Done Promotions from junior team member to flexible worker with an avatar clearly visualize why a pay rise is justified. Flexible workers help manage liquidity risk better! Verification Acceptance Ongoing Done Table Stakes Joe David Cost Reducers Peter Rhonda P1 Generalist or T-shaped people who can move flexibly across rows on the board to keep work flowing Spoilers Steven Brian Differentiators Joann Ashok Junior who will be rotated through all 4 teams
Risk is a multi-dimensional contextual problem These are just useful examples! We must develop a set of risk taxonomies that work in context for a specific business. We can easily envisage other risk dimensions such as technical risk, vendor dependency risk, organizational maturity risk and so forth. It may be necessary to run a workshop with stakeholders to explore and expose the real business risks requiring management
Cost of Delay attaches to a deliverable So understanding cost of delay enables us to know what to pull next? Yes, however, it isn’t always relevant! Cost of delay attaches to a deliverable item. What if that item is large? Whole projects, minimum marketable features (MMFs) or minimum viable products (MVPs) consist of many smaller items. We need to understand the risks in those smaller items too, if we are to know how to schedule work, replenish our system and make pull decisions wisely
Make a long term plan to build platform replacement Required throughput (velocity) Slope in middle 3.5x - 5x slope at ends 5x 2008 2006 During the middle 60% of the project schedule we need Throughput (velocity) to average 220 features per month
Little’s Law Determines staffing level Calculated based on known lead time capability & required delivery rate Changing the WIP limit without maintaining the staffing level ratio represents a change to the way of working. It is a change to the process and will produce a change in the observed ‘common cause’ capability of the system Plan based on currently observed capability and current working practices. Do not assume process improvements.If changing WIP to reduce undesirable effects (e.g. multitasking), get new sample data (perform a spike) to observe the new capability WIP = Delivery Rate Lead Time From observed capability Treat as a fixed variable Target toachieve plan
Using Little’s Law Determines staffing level Calculated based on known lead time capability & required delivery rate At this point perhaps just a little black magic and experience may be required. Rounding 22 up to 25 would conveniently provide for 5 teams with a WIP limit of 5 items each If our current working practices/process exhibited an average WIP of 1 item per person then we require 25 people organized in 5 teams of 5 people to complete the project on-time WIP = 22 = 55/week 0.4 weeks From observed capability Treat as a fixed variable Target toachieve plan
WIP in this area should be 25 items* *photo taken early in the project before it was fully staffed/loaded Lead time Median lead time target is 2 days Alert managers if beyond 5 days