Download
1 / 18
180 likes | 631 Vues
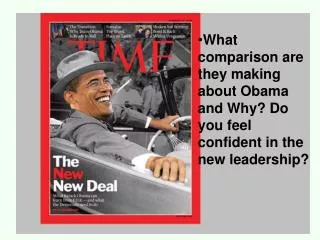
OBAMA CRYING: The night before the election, Obama was crying at a rally. Obama was not crying because he was afraid he was going to loose the White House. He was crying because he thought he was going to have to move back to CHICAGO!!!. Fiscal Cliff

E N D
OBAMA CRYING: The night before the election, Obama was crying at a rally. Obama was not crying because he was afraid he was going to loose the White House. He was crying because he thought he was going to have to move back to CHICAGO!!!
Fiscal Cliff 60% chance we will go over the Fiscal Cliff. Obama has said he will not extend the Bush Tax Cuts. He can blame the tax increases on Republicans and put pressure on them to reach a compromise on some major issues. 40% chance that Congress can reach agreement on a number of tax issues and spending cuts. Republicans have less clout now that the election is over and Fiscal Cliff would be worse.
THE “FISCAL CLIFF” By the time many of you read this newsletter, presidential election results will no longer be news, and we will need to focus on the next big crisis, the Federal Budget deficit. There are several ways to get out of this situation. Think of this just as we would a family budget with too much credit card debt: 1. We can reduce our spending, but that does not lower our monthly payment to the credit card company. In fact, it is not even making the minimum required payment. 2. We can increase our income by demanding a raise from our employer (increase taxes), but that might force him out of business (otherwise called economic recession). 3. Give everyone a raise in order to pay our bills. (runaway inflation).
The only legitimate way out is to grow our way out by increasing wages through productivity increases, which cause tax revenues to increase without increasing tax rates. Low taxes help to do that. Why shouldn’t everyone pay some tax? Isn’t that what “fairness” is all about? I paid taxes all my life, including when I had summer jobs in college. Why should people who don’t contribute to the system get to have the same say in government as paying citizens? The $16 trillion ($16,000,000,000,000) Federal debt and projected trillion dollar annual budget deficits are on investors’ minds now, as the fiscal cliff will be looming on December 31, when large tax increases and spending cuts will automatically occur if there is no agreement in Congress. It is estimated that only half of all Americans are paying any taxes. That means that each tax payer owes over $100,000 of debt that continues to increase each year. The government must stop spending. There is so much uncertainty that businesses can’t plan, and confidence is lacking, causing continued unemployment. Add to this the fact that the Federal Reserve has no more room to help if a recession comes next year. This economic expansion is already over four years old, and the average for the past century is 3.8 years.
Investment strategies will depend a great deal on the election outcome and the direction our new leaders will try to take us. We are confident that our technical indicators will continue to show us when to increase exposure to risk, and when to back away. A buy-and-hold investment strategy at this point of the economic cycle may prove disastrous to an investor’s portfolio. PRESIDENTIAL CYCLE 2012 Averaging the historical data for the 4-year election cycle, shows that the market typically firms up going into elections, and then reacts to whoever is elected. The reaction is historically stronger when the race is close, because the market cannot discount the unknown until it happens. The chart illustrates that if a Democrat is in the White House, the market should rally into mid-November before a correction. But all bullish bets are off for the year following an election, as historically it has been the worst time to be invested.
Bill Gross: About four years ago I opened up our family brokerage statement and searched with some effort to find the yield on our money market account. Interest rates, as I knew from my desk in Newport Beach, were plunging and I wondered just how much of a penalty we were being charged for the privilege of holding cash. My eyes finally fixed on the appropriate disclosure – hidden though it was – and it said “.01%.” Impossible! I thought. There must be a mistake here. Surely the decimal point was misplaced. Wasn’t “.01%” really 1% or even .1%, but definitely not “.01%.” That was close to nothing! Having counted cards at the blackjack table in my youth, I quickly calculated that over the next 12 months, our $10,000 balance would earn exactly $1.00. “Buy yourself a pair of shoes,” I said to Sue standing near my shoulder, “a pair of sandals at the weekend garage sale.” The remark was not well received. It seemed Sue was as sensitive about shoes as I was about interest rates. Note to self: Do not mention shoes with Sue except in the phrase “what a cute pair of shoes.”
Financial repressionAnyway, I quickly drifted back to my childhood days when I had a passbook at the local bank. Deposit rates were usually 4% or so back then, so I wondered how much money I would have needed then to produce the same $1.00 of interest I was receiving now. Twenty-five bucks! Whoa, $25 vs. $10,000! Seems like it was much better to be a saver back in 1958 and much better to be a spender in 2012. I could now take the $9,975 difference, spend it, and still have the same $1.00 of interest that I had back then! And that, Mr. Genie, with the Flavor Flav clock, is what is known as “financial repression.” By lowering interest rates to near zero through Fed Funds policy and quantitative easing, Ben Bernanke and his fellow central bankers are trying to force all of us to spend money.Admittedly, the Fed’s theoretical foundation takes a different route to the same destination than does mine. Chairman Bernanke would say that by lowering yields, investors would logically sell their bonds to the Fed (QE I, II and III) and invest in something riskier and higher returning (high yield bonds, stocks and real estate). My $10,000 then, would do what capital has always done – gravitate to the highest reward/risk ratio available and in the process, stimulate investment and create jobs. The theoretical $9,975 that I might have chosen to “spend” in my first example would in the Chairman’s construct be eventually spent as well but in this case via investment and job creation, which in turn would lead to a virtuous cycle resembling the “old” as opposed to the “new” normal.
The difference between these two hypothetical models is critical. Is the money that is being made “available” through zero-based interest rates and quantitative easing being “spent” – or is it being “invested?” If it’s being spent, then at some point the game will come to an end – my $9,975 will have provided me and the economy some breathing room and some time to kick the future “big R” or “little d” down the road; but it will end. If it is being invested and invested productively, then we might eventually see the Old Normal on the horizon, reduce unemployment to less than 6% and return prosperity to the middle class.Well, as President Obama might tell Governor Romney – “just do the math.” Or as Chris Berman might say on ESPN – “let’s go to the tape.” In the past three years of quantitative easing and financial repression, can we see a noticeable effect on investment as opposed to consumption? Is the Bernanke model working or is the $9,975 being spent on consumption? At first blush, an observer might vote for the Bernanke model. After all, the stock market has doubled in three-plus years, risk spreads are at historical lows, and housing prices are moving up – 10% higher in Southern California alone. Yet the real economy itself seems no different – still in New Normal gear. Surely by now, if the Bernanke model was as advertised, we would be seeing a pickup in investment as a percentage of GDP and a willingness to start saving “seed corn” as opposed to eating “caramel corn.” As Chart 1 points out – we are not. At the same time, we continue to consume at an “Old Normal” pace as shown in Chart 1 as well.
To confirm the point, let me introduce additional evidence for the prosecution, a chart that is periodically presented to our investment committee by PIMCO’s Saumil Parikh, who is turning out to be potentially a Pro Bowl replacement for recently retired All-Star Paul McCulley. It’s a little complicated sounding – “net national savings rate,” but it really speaks to the heart of the question. Net national savings is the amount of government, household and corporate savings that is left over after our existing investment stock is depreciated. Think of a building decaying and depreciating over 30 years so that you’d need to save each and every year to build and pay for a new one three decades down the road. If you don’t save, you can’t buy one: Net national savings.Well, Chart 2 confirms the evidence. Over the past three years, our net national savings rate has been negative, and lower than it has ever been in modern history. The last time this occurred was in the Great Depression.
Aside from a little squiggle back close to 0% over the last year or so, there is no evidence that investment is being incented by quantitative easing. All of the money being created and freed up is elevating asset prices, but those prices are not causing corporations to invest in future production. Admittedly, the chart shows this downward spiral has been underway for decades, but financial repression and quantitative easing were supposed to be the extraordinary monetary policies that kick-started the real economy in the other direction. They have not. We have been using the lower interest rates, the $9,975 of free money, to consume as opposed to invest.
To be fair, Ben Bernanke has been operating with one arm behind his back and has been calling for cooperative stimulation from the fiscal side of this government. He has received little response – not from Democrats, not from Republicans. They have all focused on re-electing themselves as opposed to constructively plotting a way forward. That is why Election Day seems like such a futile gesture to me. Red/Blue; Republican/Democrat. What kind of choice do we have when we pull the lever? If monetary policy has shown its impotent limits, can we now trust Washington to constructively reverse a downward slide in our net national savings rate? I suspect not. I doubt if either Obama, Romney, or many of their economic advisors even know what the definition is, let alone how to reverse it.
Pearl Fisher (Oliver Juergens) Asset Rotation Model Description: The asset rotation model is a purely quantitative and rule based model. It switches automatically between different asset classes according to their relative momentum and relative strength. There is a plain future version of the model, which gets in and out of futures (like the S&P future, the crude oil future or the treasury bond future), and then there is an ETF model, which switches in and out of ETFs. Performance: Future version Performance 2012 (so far) + 7% 2011 + 39% 2010 + 24% 2009 + 33% 2008 + 57% 2007 + 15% Biggest drawdown -9%
ETF version Performance 2012 (so far) +26% 2011 +98% 2010 +86% (ETF model cannot be measured before 2010 because those ETFs did not exit before then) Biggest drawdown -9.8% C ) Weakness: So far the biggest drawdown was -9.8%. The system shows its lowest returns during times of very low volatility.
D) Strength: This is a fully automated quantitative system, which is not fitted or manipulated in any way. The big advantage is that you get what you see and that is also true going forward. The signals come fully automated and it therefore eliminates human error. The other big advantage is that since it switches between different asset classes that do well at times when some of the other asset classes fall off a cliff, like for example if stocks are aggressively selling off bonds might do well and vice versa. This system will then always try to take advantage of the asset class that is on the winning side. Losses should never run far and the amount of trades per year is manageable.
Pearl Fisher Money Management Seminar Nov 29 @ Noon and 6PM Jungman Neighborhood Library 5830 Westheimer Rd. (2 Blocks west of Galleria on right) 832-393-1860