Download
1 / 45
460 likes | 724 Vues
Managing habitat for the eastern tiger salamander and other Ambystomid salamander species. Valorie R. Titus, PhD American Public University System. Amphibian Decline. Climate Change Invasive Species Pollution Pet Trade Disease Habitat Loss. Adult A. tigrinum. Management Issues.

E N D
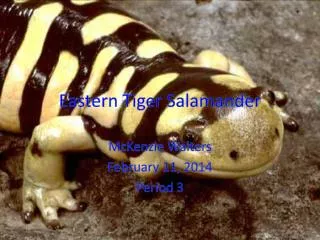
Managing habitat for the eastern tiger salamander and other Ambystomid salamander species Valorie R. Titus, PhD American Public University System
Amphibian Decline • Climate Change • Invasive Species • Pollution • Pet Trade • Disease • Habitat Loss Adult A. tigrinum
Management Issues • Habitat Use/Quality • Movement/Buffer Zones • Population genetics • Relocation, Repatriation, Translocation Typical A. tigrinum breeding pond
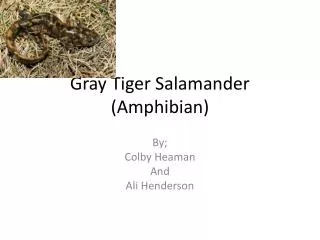
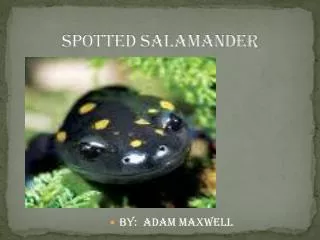
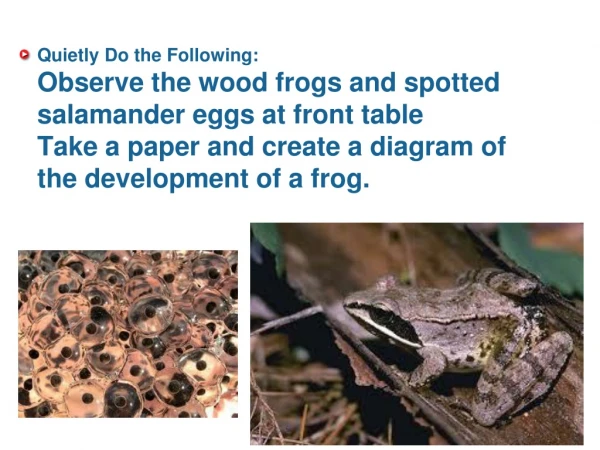
Eastern Tiger Salamander • Ambystoma tigrinum • NYS Endangered • Decreasing throughout their range • Many areas on Long Island are in danger of development Pre-metamorphic A. tigrinum
Current Range http://www.dec.state.ny.us/website/dfwmr/wildlife/endspec/tisafs.html
Current Range in N.Y. http://www.dec.state.ny.us/website/dfwmr/wildlife/herp/eatisala.gif
Current Legal Protection • New York State Freshwater Wetland Act: 30 m buffer surrounding wetlands • NYS DEC Recommendations: 164 m, no more than 50% upland habitat within 305 m of breeding pond be converted to unusable habitat (based on Semlitsch 1998) Recent metamorph
Movements • Brookhaven National Laboratory, Long Island, N.Y. • Over 5000 acres • 22+ confirmed salamander ponds on site • 3 Focal Ponds: L1, L3, L7 • Tiger Salamander management and monitoring protocols already in place
Methods • Collected males and females upon emigration from breeding ponds • Collected juveniles upon emigration or just before final metamorphosis Pre-metamorphic A. tigrinum
Results • Movements at night during rain event • Some short movements after implant replacement • Avoided open fields, development, planted white pine stands Adult A. tigrinum outside burrow
Results • Tracked 33 males, 26 females, 47 metamorphs • Predation: Bullfrog, Eastern Hognose Snake, Raccoon, Northern Short-Tailed Shrew, Eastern Ribbon Snake Radiotransmitter with B. brevicauda tooth marks
Results • Recovered a greater proportion of implants from males (72.2%, 24 of 33) than females (30%, 8 of 26) (Fisher Exact Probability, P=0.001) • No difference between number of implants recovered (N=25) and lost (N=22) for juveniles • More likely to recover implant from juveniles remaining closer to the breeding pond (Z=2.750, P=0.006) Juvenile A. tigrinum size differences
Conclusions • Predation may be higher closer to breeding pond • Males may stay closer as a reproductive strategy • Females may move farther to reduce resource competition • Optimal pond conditions during development may influence juvenile dispersal • Traditionally calculated buffer zones may be inadequate for this species • Fails to protect 20% of individuals in this study, however, incorporating a 50 m edge effect, only protects 62% • May encompass unsuitable habitat and reduce availability of good habitat Pre-metamorphic A. tigrinum
Connectivity • Fragmented landscapes resulting from anthropogenic habitat modification can have a significant impact on dispersal, gene flow, and persistence of wildlife populations • Reduced genetic variation can severely compromise the ability of a population to respond to subsequent environmental change Adult A. tigrinum
Goals • Assess population genetic diversity of remaining tiger salamander populations • Quantify genetic and landscape connectivity among ponds and populations to identify potential corridors and barriers to migration Adult A. tigrinum
Methods • Collected samples from 17 breeding sites across Long Island and 9 sites in New Jersey • Collected as many samples as possible (N=2-93) from each site • Genotyped 439 individuals across 12 microsatellite loci • Samples included toe and tail clips and individual eggs from egg masses A. tigrinum egg mass
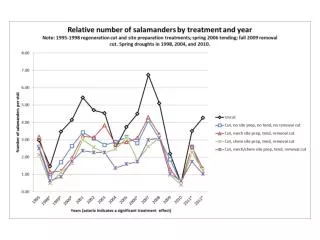
Results- Regional Population Structure and Migration • Low allelic diversity • Markers not highly polymorphic (1-13 alleles) • Mean numbers of alleles ranged from 1.1 to 3.3 in New York and 1.7 to 2.4 in New Jersey • GENEALEX version 6 (Peakall and Smouse 2006)
Results- Regional Population Structure and Migration • High levels of population differentiation between NY and NJ (average Fst=0.217) (FSTAT Goudet 1995; Weir and Cockerham 1984). • Few individuals were assigned to the pond at which they were sampled with either 80% or 95% confidence, and many of these individuals were assigned to other ponds with high confidence (GENECLASS2; Piry et al. 2004)
Results- Landscape Barriers to Migration • Defined land cover resistance values from Compton et al. (2007) and Greenwald et al. (2009) • Calculated euclidean distance, euclidean resistance, and surface resistance (using CIRCUITSCAPE version 3.3; McRae and Shah 2009); • Correlated these values with Fst using a Mantel test (Rosenburg and Anderson 2011) Adult A. tigrinum in burrow
Results- Landscape Barriers to Migration • No relationship between connectivity indices and Fst in either New York (euclidean distance: r = -0.044, p = 0.827; euclidean resistance: r = -0.047, p = 0.812; surface resistance: r = -0.056, p = 0.786) or New Jersey (euclidean distance: r = 0.120, p = 0.388; euclidean resistance: r = 0.183, p = 0.312; surface resistance: r = 0.226, p = 0.246) • No relationship between Euclidean distance and assignment probabilities in NY (R2 = 0.0005, P = 0.791), but significant for NJ (R2 = 0.361, P = 0.00001)
Conclusions • Low allelic diversity; likely from few migrants during Pleistocene (Church et al. 2002) • May make whole population susceptible to collapse in case of catastrophic event • High risk of inbreeding depression if ponds become more isolated from each other
Conclusions • 3 distinct genetic demes; while evidence of admixture, this is likely due to ancestral polymorphism rather than gene flow between NY and NJ • The second NY deme is centrally located and within 10 m of each other; likely caused by wetland remediation from 2005-2007
Conclusions • Assignment probabilities provide evidence of recent migration between several ponds • Difference between NY and NJ is likely due to distance between ponds • Corridors appear to be present in both NY and NJ, but no relationship between distance/land cover and Fst
Management • Calculate protection (buffer zones) on a case-by-case basis • Estimate probable dispersal habitat and determine available corridors • Individual breeding ponds can be susceptible to perturbations that may limit migration and dispersal
So What? • Global amphibian declines • Desire to know how to properly conserve and manage this and other amphibian species • Disease outbreaks; already confirmed Bd and Ranavirus on site • Can we actively manage this species (e.g. relocation, assisted migration)?
Literature Cited • Church, SA, Kraus JM, Mitchell JC, Church DR, Taylor DR (2002) Evidence for multiple Pleistocene refugia in the postglacial expansion of the eastern tiger salamander, Ambystoma tigrinum tigrinum. Evolution 52:372-383 • Evanno G, Regnaut S, Goudet J (2005) Detecting the number of clusters of individuals using the software structure: a simulation study. Mol Ecol 14:2611-2620 • Excoffier L, Smouse PE, Quattro, JM (1992) Analysis of molecular variance inferred from metric distances among DNA haplotypes: application to human mitochondrial DNA restriction data Genetics 131:479-491. • Goudet J (1995) fstat (version 1.2): a computer program to calculate F-statistics. J of Hered 86:485-486 • McRae BH, Shah VB (2009) Circuitscape user’s guide. The University of California, Santa Barbara. Available at: http://www.circuitscape.org. • Peakall R, Smouse PE (2006) Genalex 6: genetic analysis in Excel. Population genetic software for teaching and research. Molecular Ecology Notes. 6:288-295. • Piry S, Alapetite A, Cornuet JM, Paetkau D, Baudouin L, Estoup A (2004) GENECLASS2: a software for genetic assignment and first-generation migrant detection. J. of Hered. 95:536-539 • Pritchard JK, Stephens M and Donnelly P, (2000) Inference of population structure using multilocus genotype data. Genetics 155: 945-959. • Raymond M, Rousset F (1995) GENEPOP (version 1.2): population genetics software for exact tests and ecumenicism. J Hered 86:248-249. • Rosenburg, NA (2004) distruct: a program for the graphical display of population structure. Molecular Ecology Notes. 4:137-138. • Rosenberg MS, Anderson CD (2011) Passage: Pattern Analysis, Spatial Statistics, and Geographic Exegesis. V.2. Methods in Ecology and Evolution 2:229-232 • Schneider S, Roessli D, Excoffier L (2000) Arlequin: A software program for population genetics data analysis (version 2.0). Genetics and Biometry Lab, Department of Anthropology, University of Genevam Switzerland. • Semlitsch, R.D. 1998. Biological delineation of terrestrial buffer zones for pond-breeding salamanders. Conservation Biology 12:1113-1119. • Van Oosterhout C, Hutchinson WF, Wills DPM, Shipley P (2004) MICRO-CHECKER: software for identifying and correcting genotyping errors in microsatellite data. Molec Ecol Notes 4:535-538 • Weir BS, Cockerham CC (1984) Estimating F-statistics for the analysis of population structure. Evolution 38:1358-1370.
Acknowledgements • NYS DEC Project MOU # AM 05513 • Brookhaven National Laboratory • NYS DEC • Foundation for Ecological Research in the Northeast (FERN) • Dave Golden and the Endangered and Nongame Species Program of the New Jersey Division of Fish and Wildlife • Upstate Herpetolgical Society
Acknowledgements • Dr. Dale Madison • Dr. Tim Green • Dr. Kelly Zamudio • Al Breisch • Dr. Dan Rosenblatt • Dr. Julian Shepherd • Dr. Richard Andrus • Dr. Matthew Parker
Acknowledgements • Thank you to interns and fellow students: Sarah, Chauncey, Wendy, Frank, Jeremy, Jennifer, Esperanza, Stephen, Sarah, Emily, Carmen, Renee, Stephanie, Doris, Rachel, Dane, Katie, Kristine, Susan, Diana, Tyra, Shirin, Lauren, Matt, Miranda, Becky, Mike, Omar, Andy, Nate, Ellie, Jennifer, Miranda, Heather, Bri, Jin Joo, Sarah, Clara, Dave, Rayna, Angie, and Gui