Download
1 / 18
190 likes | 299 Vues
Trade in intermediate products and EU manufacturing supply chains. Budapest, 25 January 2011. European Commission Enterprise and Industry. Trade in intermediates – the study. Context Patterns of EU trade in intermediates Supply chains Case study. Context. What are intermediates?

E N D
Trade in intermediate products and EU manufacturing supply chains Budapest, 25 January 2011 European CommissionEnterprise and Industry
Trade in intermediates – the study • Context • Patterns of EU trade in intermediates • Supply chains • Case study
Context • What are intermediates? • Intermediate trade and globalisation
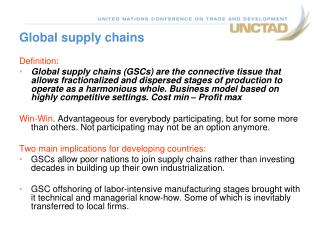
Intermediate products • Products, parts and components, used for production of a final product. • Directs inputs: parts and components used in the final products. • Indirect inputs: some parts and components consist of other inputs which thus are used indirectly. • Many goods, services, firms and countries involved in the process of a final product.
Intermediate trade and globalisation • Increased globalisation • Fragmentisation of production • Location of production globally according to comparative advantages. • Outsourcing-offshoring and Cross-border networks • Global value chains • Intra-firm trade
Patterns of EU trade in intermediate products • Overview of EU27 intermediate trade • EU27 exports and imports • Geographical patterns
Overview of EU27 intermediate tradePercent of total EU trade in 2008
EU27 trade in intermediates in 2008 (%) and 1999-2008 (percentage points)
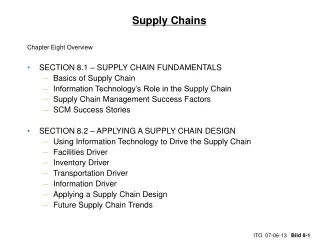
Supply chains • Manufacturing • Services • Changes over time
Imported to domestic inputs in manufacturing 1995 and 2005 (%)
Imported intermediates by industry • Manufacturing: Highest shares of imported intermediates in high-tech, 55% • Hungary, Ireland, Slovenia, Slovakia display high shares in all tech categories • Services: highest shares in transport services, 26% • Ireland, Denmark and Estonia above average all services.
Case Study – Who captures the value of the mobile phone? • Stylised picture of the supply chain • Breakdown of value by parts of the value chain • Breakdown of value by regions
The vertical supply chain of a mobile phone Distributors Smaller retailers Pure component suppliers Big retailers Firm Sub- assembliers Engines’ final assembly Assembly to order Material providers, mines, concentrating plants Sub- component suppliers Consumer Components manufactured by sub-assembliers
The value added breakdown by participants in the phone’s value chain • The brand owner, captures a half of the total value. • The distribution channel creates 14% of the total value added. • Suppliers of material inputs account for 11% of the total value added.
The phone’s value added breakdown by regions • On average, overall 55% of the value added is captured in EU-27. • Even in the case of final assembly in China and final sales in the U.S, EU-27 cap-tures 51% of the value added. • In the case when the device was assembled and sold in Europe, the share of Europe rises to 68%.
Thank you • For your attention.