Download
1 / 16
160 likes | 548 Vues
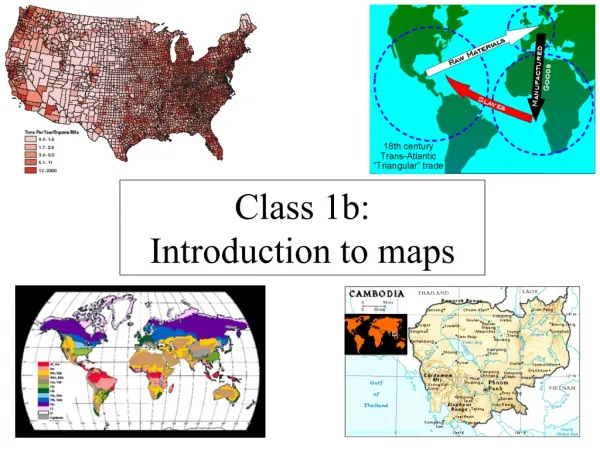
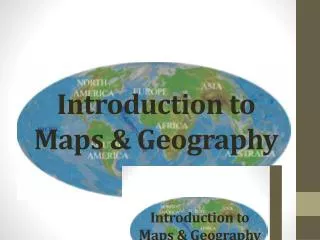
Class 1b: Introduction to maps What is a map? A generalized view of an area, usually some portion of Earth’s surface, as seen from above at a greatly reduced size Any geographical image of the environment A two-dimensional representation of the spatial distribution of selected phenomena

E N D
What is a map? • A generalized view of an area, usually some portion of Earth’s surface, as seen from above at a greatly reduced size • Any geographical image of the environment • A two-dimensional representation of the spatial distribution of selected phenomena
Why make maps? • To represent a larger area than we can see • To show a phenomenon or process we can’t see with our eyes • To present information concisely • To show spatial relationships
How do we read maps? • Maps are selective views of reality • Size of the map relative to reality (scale) • What’s on the map (symbolization) • Shape of the map (projection) • Politics of the map
Map scale • Ratio of the distance on the map to the distance on the ground • Scale is a fraction • Larger area covered means larger denominator • Larger denominator means smaller fraction • So a large-scale map covers a small area
Map scale • Ratio of the distance on the map to the distance on the ground • Graphic: • Stays the same when photocopied • Might not be right for the whole map
Map scale • Verbal: 1 inch equals 10 miles • Easy to understand • Can change if photocopied
Map scale • Representative fraction or ratio: 1:24,000 • Units don’t matter • Can change if photocopied
Map symbolization • Symbols are a code instead of text • Three kinds: point, line, area • Consider shape, size, orientation, pattern, color, value
Point symbols • Every symbol counts as one occurrence • Qualitative points • Indicate location • Can also describe that location • Quantitative points • Show a distribution • Indicate a value (graduated symbols)
Line symbols • One-dimensional • Mostly taken for granted (borders, roads) • Isolines connect same values • Flow-line maps indicate value by width of line
Area symbols • Each territory or region has one value • Differences in kind • Differences in value • Choropleth maps • Usually, darker indicates more • Cartograms distort area to show value
Politics of maps • Remember that maps are selective • What counts as a country’s borders? • What’s “east” or “west”? • Depends on who’s drawing the map
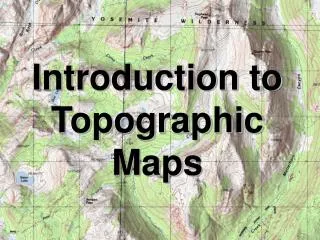
Topographic maps • Also called quadrangles • Nearly 54,000 for the U.S. • Done by the US Geological Survey (USGS) since 1897 • Map out the entire country in a standard fashion
Topographic maps • Till the 1940s, you climbed to the highest point and plotted what you could see from there • Aerial photography after WWII • Two overlapping photos are put in a stereoscope • 10 photos for each 7.5 minute map
Topographic maps • Show 2D features, point, line and area; also show 3D via contour lines • Common symbols are in the appendix of the text • Note the contour interval at the bottom of the map