Download
1 / 31
310 likes | 742 Vues
Physician Assistants: PArtners in medicine Definition of PAs Physician Assistants (PAs) are licensed health professionals who Practice medicine with physician supervision Exercise autonomy in medical decision making Provide a broad range of diagnostic and therapeutic services

E N D
Physician Assistants:PArtnersin medicine
Definition of PAs Physician Assistants (PAs) are licensed health professionals who • Practice medicine with physician supervision • Exercise autonomy in medical decision making • Provide a broad range of diagnostic and therapeutic services • May also perform educational, research, and administrative activities
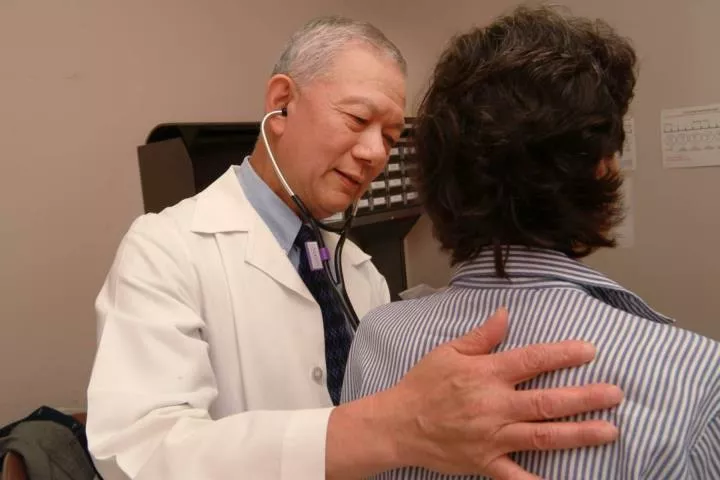
PAsPractice Medicine • Perform physical exams and take patient histories • Diagnose and treat illnesses • Order and interpret laboratory tests • Assist in surgery • Write prescriptions (in nearly all states) • Provide patient education and counseling
PAs by Specialty Other 14.4% Emergency Medicine 9.7% Family/General Medicine 26.5% Surgery & Surgical Subspecialties 24.9% Obstetrics/Gynecology 2.3% Pediatrics & Pediatric Subspecialties 4.0% Internal Medicine & IM Subspecialties 18.2% Source: AAPA, 2006 Census
Hospital 22.4% PA Employers HMO 2.1% Group Practice 44.1% Solo-Physician Practice 12.9% Other 18.5% Source: AAPA, 2006 Census
Community Need “The geographic distribution of PAs more evenly matches the population than other primary care providers. Seventh Report to the President and Congress on the Status of Health Personnel in the United States — U.S. Department of Health and Human Services
PA Distribution Northeast – 22.7% North Central – 21.0% West – 19.1% Southeast – 23.7% South Central – 13.4% Source: AAPA, 2006 Census
Where PAs are Authorizedto Prescribe * DC No Yes *California PAs may write "drug orders" which, for the purposes of DEA registration, meet the federal definition of a prescription. AK HI Guam Source: AAPA 2007
PA Education • Averages 26 months • Competency-based rather than degree-based • First 9 to 12 months in classroom: • Anatomy • Biochemistry • Microbiology • Pathophysiology • Pharmacology • Physical Diagnosis
PA Education • Second 12 to 15 months in rotations (more than 50 weeks of clinical instruction) • Family Medicine • Emergency Medicine • Internal Medicine • Obstetrics and Gynecology • Pediatrics • Psychiatry • Surgery
States with AccreditedPA Programs DC Yes No AK HI Guam Source: AAPA 2007
PA Certification • States require national certification. • To obtain certification, a PA • Must be a graduate of an accredited PA program • Must pass the national exam administered by the National Commission on Certification of Physician Assistants (NCCPA)
PA Certification • To maintain national certification, a PA • Must log 100 hours of continuing medical education (CME) every 2 years • Must sit for recertification exam every 6 years • Only health care profession to require recertification by exam every 6 years
Growth of the PA Profession(number of people eligible to practice as PAs by year) 80,000 70,000 60,000 50,000 40,000 30,000 20,000 10,000 0 70 75 80 85 90 96 97 98 99 00 01 02 03 04 05 06 Source: AAPA 2007
Physician Assistants:PArtnersin medicine
PA Fast Facts There were approximately 64,000 practicing PAs as of January 2007. 231 million patient visits were made to PAs in 2006. According to the U.S. Department of Labor, the number of PA jobs will grow faster than the national average for all professions, increasing by 50% between 2004 and 2014. PAs wrote approximately 286 million prescriptions in 2006. Source: AAPA 2007