Download
1 / 27
270 likes | 488 Vues
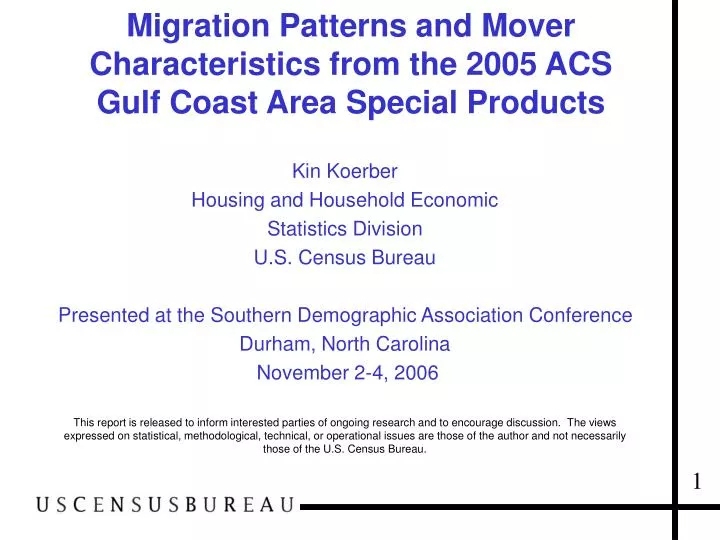
Migration Patterns and Mover Characteristics from the 2005 ACS Gulf Coast Area Special Products. Kin Koerber Housing and Household Economic Statistics Division U.S. Census Bureau Presented at the Southern Demographic Association Conference Durham, North Carolina November 2-4, 2006

E N D
Migration Patterns and Mover Characteristics from the 2005 ACS Gulf Coast Area Special Products Kin Koerber Housing and Household Economic Statistics Division U.S. Census Bureau Presented at the Southern Demographic Association Conference Durham, North Carolina November 2-4, 2006 This report is released to inform interested parties of ongoing research and to encourage discussion. The views expressed on statistical, methodological, technical, or operational issues are those of the author and not necessarily those of the U.S. Census Bureau. 1
2005 ACS Gulf Coast Area Special Products • 2005 ACS sample split between the first 8 months of the year (before the hurricanes) and the last 4 months (after the hurricanes). • ACS asks residence 1 year ago. 2
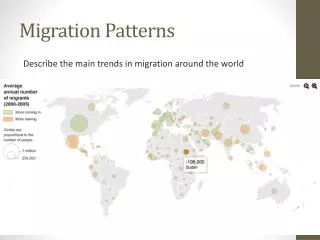
2005 ACS Gulf Coast Area Special Products Migration data Same house (nonmovers) Moved within same county Moved from different county, same state Moved from different state Moved from abroad 3
Overview Compare 2004 ACS data with the 8-month (before) and 4-month (after) data at the state level. -Are migration patterns similar for the 2004 ACS and 8-month estimates? -If so, are the migration patterns for the 8- month and 4-month different? 4
Overview Compare the 8-month and 4-month data below the state level. -What are the differences in migration patterns that are significant for certain areas? -Where are movers going (i.e. flows)? 5
Overview Examine Characteristics for those staying and leaving New Orleans. -What characteristics had significant changes? - Are there differences across racial groups? 6
Comparing 2004 ACS data with the 8-month and 4-month data(State Level) Limitations 2004 collected in only 1,240 counties Different MSA definitions Special Products do not use controls 7
Comparing 2004 ACS data with the 8-month and 4-month data(State Level) Lived in area 1 year ago and currently in U.S. -Nonmovers -Movers within same area -Movers to different area in U.S. Movers from different area within U.S. Movers from abroad 8
Comparing 2004 ACS data with the 8-month and 4-month data(State Level) Methodology Calculate the percentage-point difference between 2004 ACS and 8-month estimates as well as 8-month and 4-month estimates. Use z-score test to determine whether the difference is significant at the 90 percent confidence level. 9
Significant Differences for 2004 and 8-month Comparison (State Level) -Nonmovers in Texas (+0.9) -Movers within Texas (-0.9) Comparisons of percentage-point differences between these mover statuses may not be statistically different. 10
Significant Differences for 8-month and 4-month Comparison (State Level) Louisiana Nonmovers (-7.7) Movers to a different area (+6.0) Movers within same area (+1.7) Comparisons of percentage-point differences between these mover statuses may not be statistically different. 11
Significant Differences for 8-month and 4-month Comparison (State Level) Mississippi Nonmovers (-4.6) Movers within same area (+2.8) Movers to a different area (+1.9) Comparisons of percentage-point differences between these mover statuses may not be statistically different. 12
Significant Differences for 8-month and 4-month Comparison (State Level) Texas Movers from different area in U.S. (+0.8) Remainder of the U.S. Movers from different area in U.S. (+0.1) Comparisons of percentage-point differences between these mover statuses may not be statistically different. 13
The Fifteen Selected Areas • Alabama – FEMA designated counties, remainder • Louisiana – Baton Rouge MSA, New Orleans MSA, Lake Charles MSA, other FEMA designated counties, remainder • Mississippi – Gulfport-Biloxi area, other FEMA designated counties, remainder • Texas – Beaumont-Port Arthur MSA, Houston area, other FEMA designated counties, remainder • Remainder of the U.S. 14
Significant Differences for 8-month and 4-month Comparison • New Orleans MSA • Nonmovers (-31.3) • Movers from different area, same state (-0.7) • Movers to different area, same state (+7.1) • Movers to different state (+22.0) • Movers from abroad (-0.2) • Comparisons of percentage-point differences between these mover statuses may not be statistically different. 15
Significant Differences for 8-month and 4-month Comparison • Gulfport-Biloxi area • Nonmovers (-16.5) • Movers to different state (+6.7) • Comparisons of percentage-point differences between these mover statuses may not be statistically different. 16
Significant Differences for 8-month and 4-month Comparison • Other FEMA designated counties in Louisiana Movers from different area, same state (+2.4) • Remainder of Louisiana • Movers from different area, same state (+2.1) • Comparisons of percentage-point differences between these mover statuses may not be statistically different. 17
Significant Differences for 8-month and 4-month Comparison • Other FEMA designated counties in Mississippi • Movers from different state (+1.5) • Houston area • Movers from different state (+1.5) • Comparisons of percentage-point differences between these mover statuses may not be statistically different. 18
Mover Flows • From New Orleans MSA to: • Remainder of Alabama (+1.2) • Baton Rouge MSA (+5.8) • Within New Orleans (-49.7) • Houston area (+12.8) • Remainder of Texas (+10.2) • Remainder of the U.S. (+11.3) • Comparisons of percentage-point differences between these geographies may not be statistically different. 19
Mover Flows • From Other FEMA designated counties in • Texas to: • Houston area (-13.3) 20
New Orleans MSA Characteristics • Population 1 year and over • 8-month estimates • Before Katrina • 4-month estimates • Stayed in New Orleans MSA- Nonmovers & Movers within New Orleans MSA • Moved outside the MSA 21
New Orleans MSA Characteristics *The Before Katrina and Stayed in New Orleans MSA estimates are not statistically different 22
New Orleans MSA Characteristics *The Before Katrina and Stayed in New Orleans MSA estimates are not statistically different 23
New Orleans MSA Characteristics *The Before Katrina and Stayed in New Orleans MSA estimates are not statistically different 24
New Orleans MSA Characteristics *The Before Katrina and Stayed in New Orleans MSA estimates are not statistically different 25
New Orleans MSA Characteristics *The Before Katrina and Stayed in New Orleans MSA estimates are not statistically different 26
Conclusion • The sample for the ACS Special Products for the Gulf Coast Area is large enough to show changes in migration in some areas due to the hurricanes. • Those that moved out of New Orleans tended to be African American, younger, single or separated, to be in poverty, living in renter-occupied housing, and less likely employed. 27