Download
1 / 25
250 likes | 415 Vues
Microanalysis in Science and Engineering. Climate Analysis Using Planktonic Foraminifera. Earth Science or Biology. Contact Information. Jenene Kell and Jenny Norris k ellj@k12tn.net norrisj@k12tn.net Warren County High School. Performance Indicators.

E N D
Microanalysis in Science and Engineering Climate Analysis Using Planktonic Foraminifera. Earth Science or Biology
Contact Information Jenene Kell and Jenny Norris kellj@k12tn.net norrisj@k12tn.net Warren County High School
Performance Indicators • Earth Science Standard: 4.0 Geologic History Recognize that fossils contained in sedimentary rock provide clues to life forms, changes in those life forms, and environmental changes. • Biology Standard: 6.0 Biological Evolution Predict how environmental changes will encourage or discourage the formation of a new species or extinction of an existing species, given a written scenario.
Performance Indicators • Mathematics Curriculum Standards (Statistics) Construct and draw inferences from charts, tables, and graphs that summarize data from real-world situations. • Mathematics Content Standard 1.0 Solve multi-step real-world problems involving whole numbers, fractions, decimals, and percents.
Textbook Reference(s) • Modern Earth Science. Holt, Rhinehart, and Winston. Austin, 2002. (Chapter 18: A View of the Earth’s Past, pgs. 344-363) • Biology: Principles and Explorations. Holt, Rhinehart, and Winston. Austin, 2001. (Chapter 13: The Theory of Evolution, pgs. 274-299)
Materials Needed • Graph paper • Calculator • Mounted slides of microfossils, including forams • Compound light microscope
CATEGORY Excellent Good Satisfactory Needs Improvement Participation All group members used time well in lab and focused attention on the experiment. All group members used time pretty well. Stayed focused on the experiment most of the time. All group members did the lab but did not appear very interested. Focus was lost on several occasions. Participation was minimal OR some students were hostile about participating. Calculations All calculations are shown and the results are correct and labeled appropriately. Some calculations are shown and the results are correct and labeled appropriately. Some calculations are shown and the results labeled appropriately. No calculations are shown OR results are inaccurate or mislabeled. Drawings/Diagrams A clear, accurate graph is included and makes the experiment easier to understand. The graph is labeled neatly and accurately. A clear graph is included and is labeled neatly and accurately. A graph is included and is labeled. Needed graph is missing OR is missing important labels. Summary Summary describes the skills learned, the information learned and some future applications to real life situations. Summary describes the information learned and a possible application to a real life situation. Summary describes the information learned. No summary is written. Rubric
Special Notes • We are assuming that the students have background information regarding fossils and the geologic time scale. • The activity included in this lesson deals with Neogloboquadrina pachyderma. Mounted specimens of this microfossil are not required. Any foram slide will be sufficient in order to provide examples to the student. • Sediments for this lesson can be collected from the Coon Creek area in Selmer, TN. • We expect this lesson to last 1 period (block scheduling).
Title Page for Classroom Climate Analysis Using Planktonic Foraminifera
Engagement • Observe the displayed sediments. • Where do you think this sediment was collected? • Do you think this sediment contains any fossils? • Sieve the sediment. • Extract any microfossils found. • Examine this specimen under the microscope.
Exploration • Does anyone remember what the definition of a fossil is? • What do you think a microfossil is? • Do you think we can find any microfossils in our region? • Do you think that there are any living relatives of these microfossils?
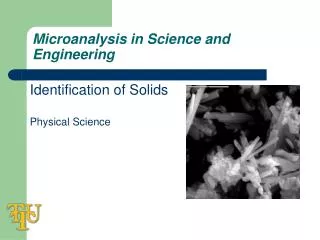
Explanation • The microfossils that we are studying today are called foraminifera or forams. Forams are single-celled amoeboid protists. They are abundant all over the ocean. There are approximately 4,000 species living today. Forty of these species are planktonic (live in the upper water column) and the rest are benthic (found in sea bottom or ground water sediments).
Explanation • The foraminiferal test is typically 0.05mm to 0.5mm. Some may be as large as 18cm. They remain single-celled despite possible large sizes. • Typical forams may be viewed under a compound light microscope. However, there are defining characteristics of the three main types of forams that are best viewed using an electron microscope.
Explanation • Electron microscopy is an imaging technology that uses the properties of electrons rather than light.
Explanation The electron microscope allows your sample to be magnified up to 100,000 times.
Explanation • The environmental scanning electron microscope (ESEM) at TTU in Cookeville, TN was used to capture many of the images you’ll see today. A unique property of this microscope is that it allows us to view samples at pressures up to 20 torr and in more natural environments.
Explanation • The three main types of forams include: 1. Hyaline – exhibits a perforated test (shell).
Explanation 2. Agglutinated – exhibits a test composed of small particles that have been “glued” on.
Explanation 3. Porcellaneous – exhibits an imperforated, smooth test that resembles porcelain.
Extension or Elaboration • CLIMATE ANALYSIS USING PLANKTONIC FORAMINIFERA • 1) You have been given a series of samples containing planktonic foraminifera representing time from the present to 160,000 years ago. After your analysis of the material, you decide to look at the climatic signal from these samples. You are aware that a particular species of foraminifera, Neogloboquadrina pachyderma, is an excellent recorder of water temperature through geologic time. When the earth experiences periods of relatively cold temperatures, ocean waters are cooler and Neogloboquadrina pachyderma forms its test (shell) such that it coils to the left. Alternatively, during periods of relatively warm temperatures when ocean waters are warmer, Neogloboquadrina pachyderma constructs its test with a coiling direction to the right. Therefore, you have separated out the specimens of Neogloboquadrina pachyderma from your samples. For each sample you have counted how many of this species coil to the left and how many coil to the right. Your data is recorded in Table 1. Your next step is to calculate the percentage data for each sample. You must calculate percentage data so that your information is not biased by the total amount of foraminifera present in the sample. Complete the worksheet in Table 1 by calculating the total number of Neogloboquadrina pachyderma for each sample and the percentages of right- and left-coiling forms of the species. The first sample is done for you on the worksheet.
Age (years ago) Right coiling Neogloboquadrina pachyderma Left coiling Neogloboquadrina pachyderma Total number Neogloboquadrina pachyderma % Right coiling Neogloboquadrina pachyderma % Left coiling Neogloboquadrina pachyderma 0 230 50 280 82% 18% 10,000 220 75 20,000 70 230 30,000 45 300 40,000 50 302 50,000 65 389 60,000 20 140 70,000 56 287 80,000 63 267 90,000 212 56 100,000 120 23 110,000 87 45 120,000 203 66 130,000 56 205 140,000 45 332 150,000 89 135 160,000 123 166 Extension or Elaboration Table 1. Coiling Ratios Worksheet
Extension or Elaboration • 2) Next, use graph paper to plot your results. On the vertical axis you should plot the age of the samples with "0" at the top and "-160,000" at the bottom. On the horizontal axis, plot the percentage of right-coilingNeogloboquadrina pachyderma with "0%" on the left side and "100%" on the right side. You should now have a graph representing the climatic signal derived from the coiling ratios of Neogloboquadrina pachyderma. • 3) Analyze your graph and make an interpretation of the climatic history on our planet during the last 160,000 years. Describe this history in your lab report and provide evidence for this interpretation.
Evaluation • Lab reports over the previous activity will be collected from each group of 3-4 students. • Teacher will use the rubric to evaluate student mastery of the performance standards.
End Notes • Fossil records can be excellent indicators of environmental changes that have occurred during Earth’s history. • Microscopes, especially electron microscopes, have aided in the study of microfossils. • Microfossils can also be used to predict trends in climatic changes of the Earth.
References • www.ucmp.berkeley.edu/fosrec/Olson2.html • www-bprc.mps.ohio-state.edu/foram/whatarefor.htm • www.ucmp.berkeley.edu/collections/micro.html