Download
1 / 29
290 likes | 391 Vues
Climate Information for Hydrological Outlooks. Source: NOAA CDC. Source: NOAA CPC. David Wratt, Roddy Henderson, Charles Pearson & James Renwick NIWA, New Zealand. Technical Conference on Changing Climate and Demands for Climate Services for Sustainable Development

E N D
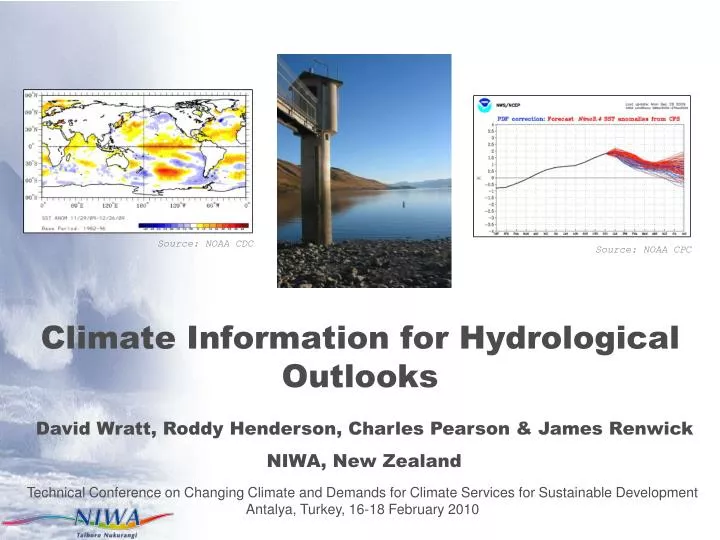
Climate Information for Hydrological Outlooks Source: NOAA CDC Source: NOAA CPC David Wratt, Roddy Henderson, Charles Pearson & James Renwick NIWA, New Zealand Technical Conference on Changing Climate and Demands for Climate Services for Sustainable Development Antalya, Turkey, 16-18 February 2010
Outline Methodology overview Seasonal climate Updates & Outlooks Present conditions Predictability Information used for outlooks The probabilistic projections Producing hydrological outlooks Skill Further guidance products Summary
National information base Climate stations • 208 open climate stations (118 automatic) • ~70 soil moisture sites (some NIWA, some local government) - combine with modelled soil moisture from climate data • Hydrometric network >600 open stations (NIWA + local government)
Climate “update” Rainfall anomaly January 2010 Mean T anomaly January 2010 Sunshine anomaly January 2010
Soil moisture “update” Historical average deficit At 9am on 1 Feb (mm) Actual deficit at 9am on 1 Feb 2010 (mm) Anomaly at 9am on 1 Feb 2010(mm)
Catchment river flows “update” At end January 2010
Potential Seasonal Predictability - NZ About 50% of the variance of seasonally-averaged temperature is potentially predictable (less in winter). Madden & Kidson, IJC, 1997 Only 30% or less of the interannual variance of seasonal precipitation is potentially predictable. Madden et al, IJC, 1999. Studies by Madden and colleagues in the 1990s (IJC 1997, 1999) suggest:
Seasonal influences - ENSO state Rain anomaly Rain anomaly “Average” El Niño Summer “Average” La Niña Summer
Information: Current ENSO state CDC SST anomalies (27 Dec 2009 - 23 Jan 2010) http://www.cdc.noaa.gov/map/images/sst/sst.anom.month.gif NIWA SOI January 2010: SOI -0.6 (3-month -0.8)
Information: Predicted ENSO State Dynamical Statistical Loosely Adapted from http://www.bom.gov.au/climate/ahead/ENSO-summary.shtml
Information: SST around New Zealand November2009 December2009 January 2010
Regional climate projections from modelling centres IRI APEC Climate Centre Precip Feb-April 2010 Temperature Feb-April 2010
Six climate forecasting regions Northland, Auckland, Bay of Plenty Central North Is, Taranaki, Whanganui, Manawatu, Wellington Gisborne, Hawkes Bay, Wairarapa West Coast, Alps and Foothills, Inland Otago, Southland Nelson, Marlborough Coastal Canterbury, East Otago
Statistical model predictions based on present conditions For Feb - Mar - Apr 2010
Summary of Projections For Feb - Mar - Apr 2010
Consensus probabilistic outlook tables For Feb - Mar - Apr 2010
Moving to Hydrological Outlooks 1-2 hydrologists participate in climate outlook teleconference Material on present state and projections passed to ~8 hydrologists They do individual forecasts, and merge into a consensus
Assessment by one hydrologist For FMA 2010
Merging into a “consensus” assessment For FMA 2010
Further hydrological product for water supply utility Now Demand: average Climate terciles: 25%;50%;25%
Example: hydro-electricity warning La Niña projections starting May 2007 These were significant and serious warnings for both generators and users!
Summary Common seasonal climate outlook products + information on present state together provide sufficient input for producing hydrological seasonal outlooks (for soil moisture, catchment flows) Skill of climate forecasts for NZ is real but modest. Potential level of predictability sets limits NIWA flow outlooks have higher skill levels overall than rainfall outlooks (influence of initial conditions?) Media want climate outlooks, but often don’t (or won’t) understand limits Using probabilistic outlooks requires sophisticated approach by end-users. There is potential for collaborating with users to develop further products targeted to their needs