Download
1 / 14
140 likes | 362 Vues
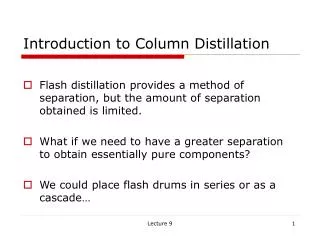
Introduction to Metview and the Single Column Model. Iain Russell Sándor Kertész Meteorological Visualisation Section ECMWF. What is Metview?. Working environment for Operational and Research Meteorologists Interactive user interface and batch

E N D
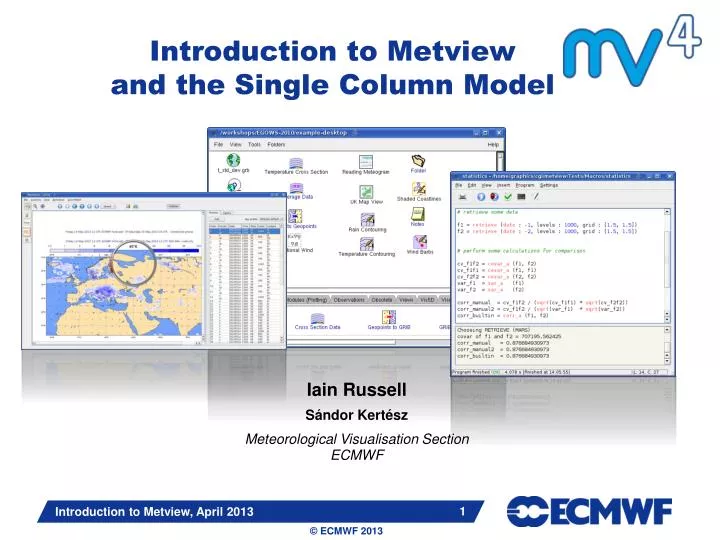
Introduction to Metviewand the Single Column Model Iain Russell SándorKertész Meteorological Visualisation Section ECMWF Introduction to Metview, April2013
What is Metview? • Working environment for Operational and Research Meteorologists • Interactive user interface and batch • Can retrieve/manipulate/visualisemeteorological data • Runs on UNIX systems • Open Source under Apache Licence • since August 2012 • Metview is a co-operation project between ECMWF and INPE (Brazil) • Built on core ECMWF technologies: • Mars, GRIB_API, Magics, ODB, emoslib Introduction to Metview, April 2013
What is Metview? • Data: • Access • Examine • Manipulate • Plot • Overlay • Can be run interactively or in batch using powerful Macro language • Can be easily installed and runs self-contained standalone • From laptops to supercomputers • No special data servers required (but can be easily connected to MARS or local databases) GRIBBUFRNetCDFODBGeopoints ASCII Introduction to Metview, April 2013
User interface – desktops and icons • A desktop corresponds to a directory on the file system • Everything is represented by an icon • Data, settings and processes ; drag and drop Desktop containing user icons Tabbed icon drawers Introduction to Metview, April 2013
Icons – creation • Data: just copy your data files into ~/metview or a subdirectory • Other: find the appropriate icon in one of the Icon Drawers and drag it onto the desktop • Alternatively, right-click on the desktop and choose ‘New Icon’ Desktop Tabbed icon drawers contain empty icon templates Introduction to Metview, April 2013
Modifying an SCM input data file Vertical level ‘zoom’ • Custom editor for SCM input netCDF files Editable table and curve Introduction to Metview, April 2013
Icons – editing • right-click, edit an icon • data inputs icons can be dropped into the editor Apply = Save Introduction to Metview, April 2013
Running the SCM through Metview • Edit your copy of the Scm Run icon • Set the path to the SCM executable • Set the input data and namelist • Apply, then right-click, execute • By default, the result is stored ‘in the background’ and can be accessed via the Scm Run icon • Editor has an option to copy the output file in order to keep a copy Introduction to Metview, April 2013
Visualising data in Metview • For most data types, just right-click in the icon and select visualise • For netCDF, there is no default visualisation so this approach does not work • We use ‘visualiser’ icons • The ScmVisualiser icon has high-level options to produce different plot types and to compare two runs • The NetCDF Visualiser icon is available for lower-level specification of plotting from netCDF files Introduction to Metview, April 2013
SCM Visualisation in Metview Time-value curve Time-sliced profiles Time-height matrix Introduction to Metview, April 2013
Examining data • Statistics of data are shown in sidebar of plot window • Metview provides tools to inspect data to • check contentsand structure • inspect headers • spot errors or inconsistencies • Supported formats:GRIB, BUFR, ODB, netCDF, GeoPoints • Or through the Examinersfrom the user main interface by Right click > Examineor standalone: metview4–e gribtest.grib(–e bufr , –e odb ) Display window with data statistics (right) NetCDFExaminer Introduction to Metview, March 2013
OpenIFS support in Metview • OpenIFS: “… to provide research institutions with a portable, easy-to-use version of the ECMWF IFS model. “ • Presents an opportunity to extend the Metview community • All the Metview functionality works with the OpenIFS output • Examples icons are available from: https://software.ecmwf.int/wiki/display/OIFS/Using+MetView+with+OpenIFS Introduction to Metview, April 2013
Many more features … Strike Probability Map Clusters Tephigram Metgrams Hovmøller Scatterplots EUMETSAT WMS WMS with Satellite and radarby NOAA nowCOAST Interface with FLEXTRA Introduction to Metview, April 2013
For more information … email us: • Metview: metview@ecmwf.int visit our web pages: • https://software.ecmwf.int/metview • Download • Documentation and tutorials available • Metview articles in recent ECMWF newsletters Introduction to Metview, April 2013