Download
1 / 26
280 likes | 546 Vues
Lecture 3.4: M easuring Biodiversity. Ch 5 & 6 Select pages. Diversity of Species. Ecosystem diversity Species diversity Genetic diversity. How Many Species on Earth?. Classified 2 million (Taxonomy) KPCOFGS Catharanus roseus 5 to 100 estimated

E N D
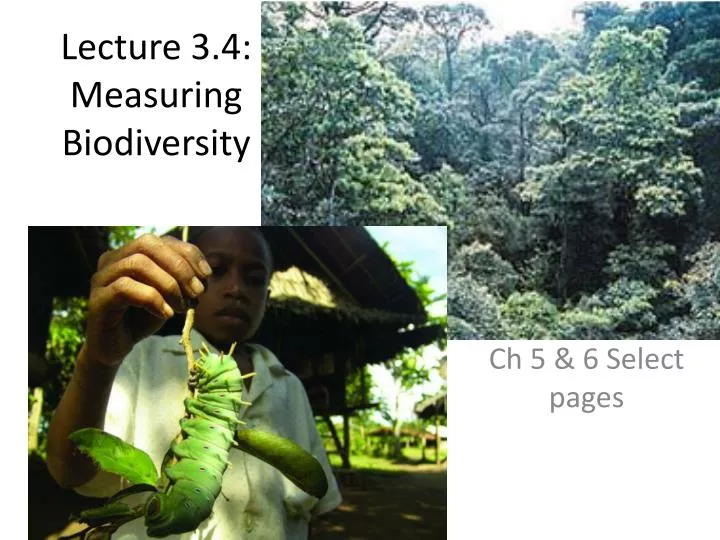
Lecture 3.4: Measuring Biodiversity Ch 5 & 6 Select pages
Diversity of Species • Ecosystem diversity • Species diversity • Genetic diversity
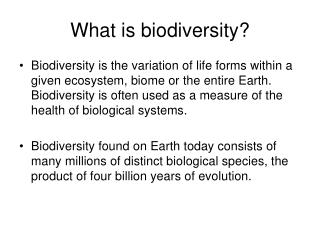
How Many Species on Earth? • Classified 2 million (Taxonomy) • KPCOFGS • Catharanusroseus • 5 to 100 estimated • most agreed estimate~10 million different species
Beetles in one tree example Fumigate under one species in a survey area & collect all insects on a tarp
How Many Species on Earth? • Classified 2 million • 5 to 100 estimated, most agreed estimate~10 million • Beetles in one tree example
Species Evenness What is the relative abundance of individuals within different species? Is the system numerically dominated by one species?
Species Richness & Evenness • Richness- number of species in a given area • Evenness- how abundant is a species in relation to all species present • Human disturbance negatively effects these values • Research gives us a baseline.
Shannon’s Index of Diversity Higher values of H indicate higher diversity
Species No. of Individuals • Beech 32 • Maple 18 • Oak 12
Species No. of Individuals • Beech 32 • Maple 18 • Oak 12 • TOTAL 62
Enter the relative abundances in the next Enter your critters in one column Enter their abundances (=counts from your sample) in the next Like so…
Remember: relative abundance is simply the abundance divided by the total. It should always total to 1. Now we need natural logs (ln)…
LN is the formula for natural log Next multiply LN(Pi) by Pi…
Species Richness • The number of species in a community • Tropical rainforests Isolated island • Related to the abundance of potential ecological niches
Species Richness Influences(pp. 171-172) • Latitude • Time • Habitat Size • Habitat Distance from Colonizing Species
Species Richness Influences • Latitude • Time • THEORY OF ISLAND BIOGEOGRAPHY • Habitat Size • Habitat Distance from Colonizing Species
Species Richness Forest Grassland ECOTONE Where edge effect occurs Typically greater species richness