Download
1 / 27
280 likes | 387 Vues
Measuring the Differential Rotation of the Sun. By: Jeffrey Hokanson ASTR 230 Professor Johns-Krull. Purpose.

E N D
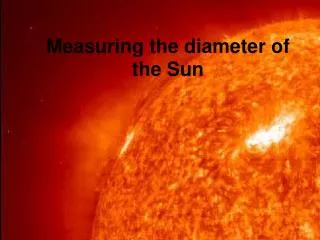
Measuring the Differential Rotation of the Sun By: Jeffrey Hokanson ASTR 230 Professor Johns-Krull
Purpose • Because sunspots and phages are relatively stationary, they can be used as reference points. My objective for this lab was to measure this differential rotation using these solar features as seen in Hα.
Data Collection: Equipment • Coronado MaxScope 40 • Philips ToUCam Pro (PCVC 740K) • VirtualDub 1.5 compressing video stream in XviD 1.0.0 R3 Codex (software) • My Laptop
Observation Times • April 14, 2004 from 2:49 to 6:49 PM • April 15, 2004 from 2:43 to 2:53 PM and 2:55 to 2:56 PM
Image Processing • The raw images from the camera were noisy and had a lot of motion in them. • This necessitated stacking. • There were too many frames at different alignments to use IRAF, so I used free program RegiStax 2.1.13.
Image Stacking • The 4+ hours of video data boiled down to four different full sun images. • These were at 2:49, 5:33, and 6:18 PM on the 14th, and 2:55 PM on the 15th. • Each portion of the sun’s disk was stacked and aligned in RegiStax 2.1.13 using between 20 and 50 frames each. • Note: RegiStax uses an average method. This is acceptable because I am concerned with location, not magnitude.
Unsharp Mask • RegiStax’s ability to use dark frames and flat fields poor at best. Since the camera moved around, flats and darks are not an issue. • A unsharp mask would correctly balance the contrast at each point and clearly reveal each object.
Unsharp Mask Continued • To do this, I made a Gaussian blur with a sigma of 10 for each image. • I subtracted a constant value from the image and made all points less than zero zero. • I divided this modified original by the Gaussian to get the image
Full Sun Images • Finally, I needed to merge the multiple images from the sun’s disk at one time period into a single image so that measurements could be taken. • I did this using Adobe Photoshop by aligning the surface features.
Rotation • The final step was to rotate the image so that it was aligned with solar North-South. • The sun’s inclination relative to celestial north varies by 23.5 sinusodially with zeros at the equinoxes. • On April the 14th, the sun was 21.18 degrees of relative celestial north. • Celestial north was determined by the motion of the telescope in declination.
Data Collection and Processing • I imported these full sun images into IRAF. • There were 21 points I attempted to track over the course four images. • I used the phot package on the inverse of each image to locate it’s center. • I recorded all this data in Excel as well as 10 points on the sun’s rim, which I used to calculate the center of the sun’s disk.
Further Data Processing • Next, I converted all these points to latitude and longitude where 90 longitude defined as the Earth-Sun line. • I gave each point a five pixel margin of error, which converted into different errors for latitude and longitude.
Data Points • As can be seen, the data points were all over the place. • There were large margins of errors for most points • Points reading with a positive period are actually moving opposite of what was observed optically.
Selected Data Points I selected only the strongest points: 1, 5, 6, 7, 8, 16, 17, and 12. • All but #12 appear on the April 15th image of the sun • The blue line is the accepted value, and as can be seen, these points are close.
Conclusions • My data does confirm differential rotation. The measured period values increase with increased latitude. • My data is also relatively close to the accepted. The slopes are close over this region and so are the individual data points. • This error could come from actual movement of the reference point (#1) when I aligned the images