Download
1 / 44
440 likes | 603 Vues
Optimization of Water Networks for Nablus Municipality. Optimization of Water Networks for Nablus Municipality. Nada Sweedan Waed Bouzia Haytham Yahya Introducing. Agenda Introduction Project Objectives Past Works Current State Optimization scenarios. The Objectives.

E N D
Optimization of Water Networks for Nablus Municipality Nada Sweedan WaedBouzia HaythamYahya Introducing
Agenda Introduction Project Objectives Past Works Current State Optimization scenarios
The Objectives Studying the current structure of the water network Improving and optimizing the water resources system Reducing the operational cost through the network Time effects on the network
Introduction Water is the most vital matter in the world And, water demand is radically increasing HUGE DEMAND VS FEW RESOURCES REAL need for Optimal state
Water Network for Nablus Municipality In Nablus Municipality , the water department is the water network controlling and managing unit.
Recently, huge efforts were done in the field of networks optimization. Most of them are based on mathematical programming. One of that: Lim, Suh, Kim, & Park, 2010 PAST WORK
Segun- Adeyefa 2011 : Multi-Objective Stochastic LP in comparison with the traditional Model. critical and optimal decision analysis are intertwined to address situations where the attendance of several objective functions and the stochastic nature of data are under one roof in a linear optimization context Elimam& Girgis, 2012 Optimization of Water Resources Planning for Jordan’s Aqaba Special Economic Zone. Mainly aiming to minimize the overall water production and delivery costs, in addition of conserving fresh water supplies.
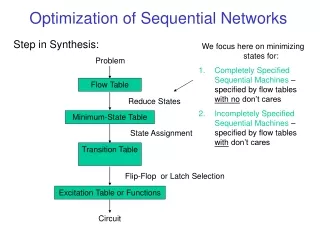
Data Gathering • Data Analysis • Formulating and modeling • Scenarios Analysis • Results THE METHODOLOGY
Reservoirs It’s the water basins in the network,
Randomly pumping water depending on demand Pumping cost allocation from Total cost = Applying in this equation the monthly pumped water and power consumption. Current state
The Electricity Consumption See appindex
Pumped water(Qij) See appendix
Applying for this, then the total resultant cost is 100,000NIS/month monthly to pump water through all the network Results
Current State Optimization Want to pump water from the reservoir to the pressure zone • reservoir Least cost Optimal Quantity • Pressure zone
Network analysis We have 11 reservoirs noted as i=1….,11 And 25 pressure zone, j=1….,25 In addition of the pressure zones demand dj Want to send xij from I to j with the least cost , in order to cover the demand
Pressure Zones j= 1,….., 25 Reservoirs i =1,……,11 Water pumped from i to j is With cost Pressure zone demand is Reservoir ceiling limit Formulation
THE MODEL The Objective Function: The Constraints:
Current state optimization UseLP SOLVE to solve the previous model The model resulted in 50,000 NIS as the total monthly pumping cost
NEXT STEP Scenarios that consider the demand change after five years The population increase annually in a range from 15%-25% in Nablus city the water demand then will increase exactly by this range Its clear that, the demand increasing its not the same in all the city regions.
First Scenario Demand increasing by the range 15%-25% 25% in the west north west 20%, in the east 15% In the middle increased by 17.5%
Formulation Objective Function: Constraints:
Pressure zones demand See appendix
The Reservoir’s Maximum Quantity See appendix
Result The model resulted in 65269.05 NISas the total monthly pumping cost
Second Scenario Investment
THE PRESSURE ZONE MONTHLY DEMAND (M3/MONTH) See appendix
Formulation Objective function Subjected to:
Result The model resulted in 57834.05 NIS as the total monthly pumping cost
Hybrid System third Scenario
THE MINIMUM QUANTITY OF THE RESERVOIRS (M3/MONTH) THE MINIMUM QUANTITY OF THE RESERVOIRS (M3/MONTH) See appendix
Formulation Objective function Subjected to:
Result The model resulted in 52770 NIS as the total monthly pumping cost
If the Municipality use our model The cost of pumping water will be reduced to the half value so they will save a lot of money and enrich there budget . • The scenarios help municipality to have long term strategic planning . Conclusions
recommendations Use the modeling as a guide to improve the water pumping system. put a strategic plan as in three scenarios to have least cost of pumping water through the network .