Download
1 / 11
110 likes | 208 Vues
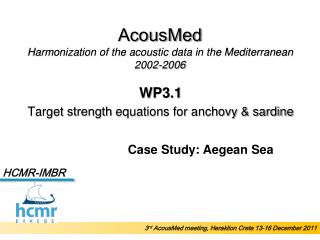
HCMR-IMBR. AcousMed Harmonization of the acoustic data in the Mediterranean 2002-2006. WP3.1 Target strength equations for anchovy and sardine. AcousMed Palma de Mallorca November 2010. HCMR: Progress of work. - 60db. -65db. Split beam method 2. slope forced to 20.

E N D
HCMR-IMBR AcousMedHarmonization of the acoustic data in the Mediterranean 2002-2006 WP3.1 Target strength equations for anchovy and sardine AcousMed Palma de Mallorca November 2010
HCMR: Progress of work -60db -65db Split beam method 2 slope forced to 20 • Night Hauls monospecific >90% • Echoview used for analysis • Echo acquisition threshold • Single targets concerning the whole water column • Bin range TS: 0.1 db Bin range TL: 0.5 cm • Regression fit for each data set
Data used: • Period: 2004-2010 • Sampling time: 20.30 – 04.45 • Majority of hauls deriving from summer surveys • 46 hauls >90% anchovy • 6 hauls >90% sardine • Max. bottom depth: 100 m • Majority of hauls max. bottom depth: 80m • TL range: 4.7 to 16.5 cm anchovy • TL range: 5.8 to 16.2 cm sardine
Target Strength & Length distribution Anchovy -60db
Target Strength & Length distribution Sardine -60db
Target Strength & Length distribution -65db Sardine -60db
Matching TS values with fish lengths: Ordinal number of the fish in the sample distribution (the first) Ordinal number of the fish in the sample distribution (the last) Ordinal number of the length value Ordinal number of TS values in the sample distribution (the first) Ordinal number of TS values in the sample distribution (the last) Ordinal number of the TS value corresponding to the . th fish with length No of individuals (haul) > No of single targets (Echogram) or No of single targets (Echogram) > No of individuals (haul) (Kasatkina 2009: The influence of uncertainty in target strength on abundance indices based on acoustic surveys: examples of the Baltic Sea herring and sprat. – ICES Journal of Marine Science, 66: 1404–1409)
Example of matching TS distribution with fish lengths: =ROUND(H3;0) =VLOOKUP(I3;A$2:B$16;2;FALSE) =(D3-$D$2)/($D$31-$D$2) =$A$2+G3*($A$16-$A$2) =J3-20*LOG(E3)
Results: But using only the targets from the fishing range in the water column: Anchovy : apply in 12 hauls estimated b20 in the total targets : -75.36 estimated b20 in the fishing range targets : -73.41 Sardine : apply in 4 hauls estimated b20 in the total targets : -70.86 estimated b20 in the fishing range targets : -70.76 Anchovy : 46 hauls estimated b20 = -75.92 Sardine : 6 hauls estimated b20= -71.96
Currently used b20 …different biomass estimates