Download

1 / 5
50 likes | 72 Vues
Learn about the similarities and differences between the density curves of normal and t distributions, and how to determine critical values using Table D. Explore examples on lung capacity and reading ability improvement.

E N D
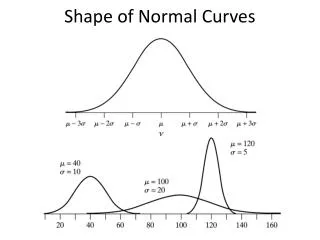
The t Distributions When comparing the density curves of the standard Normal distribution and t distributions, several facts are apparent: • The density curves of the t distributions are similar in shape to the standard Normal curve. • The spread of the t distributions is a bit larger than that of the standard Normal distribution. • The t distributions have more probability in the tails and less in the center than does the standard Normal. • As the degrees of freedom increase, the t density curve becomes ever closer to the standard Normal curve. We can use Table D in the back of the book to determine critical values t* for t distributions with different degrees of freedom. 1
Does smoking damage the lungs of children exposed to parental smoking? Forced vital capacity (FVC) is the volume (in milliliters) of air that an individual can exhale in 6 seconds. FVC was obtained for a sample of children not exposed to parental smoking and a group of children exposed to parental smoking. We want to know whether parental smoking decreases children’s lung capacity as measured by the FVC test. Is the mean FVC lower in the population of children exposed to parental smoking?
H0: smoke = no <=> (smoke− no) = 0 Ha: smoke < no <=> (smoke − no) < 0 (one sided) The difference in sample averages follows approximately the t distribution: We calculate the t statistic: In table D, for df 29 we find:|t| > 3.659 => p < 0.0005 (one sided) It’s a very significant difference, we reject H0. Lung capacity is significantly impaired in children of smoking parents.
Can directed reading activities in the classroom help improve reading ability? A class of 21 third-graders participates in these activities for 8 weeks while a control classroom of 23 third-graders follows the same curriculum without the activities. After 8 weeks, all children take a reading test (scores in table). 95% confidence interval for (µ1 − µ2): Does the directed reading activity improve reading ability? Take the significance level to be 5%?
Can directed reading activities in the classroom help improve reading ability? A class of 21 third-graders participates in these activities for 8 weeks while a control classroom of 23 third-graders follows the same curriculum without the activities. After 8 weeks, all children take a reading test (scores in table). 95% confidence interval for (µ1 − µ2), with df = 20 conservatively t* = 2.086: With 95% confidence, (µ1 − µ2), falls within 9.96 ± 8.99 or 1.0 to 18.9.