Download
1 / 36
370 likes | 643 Vues
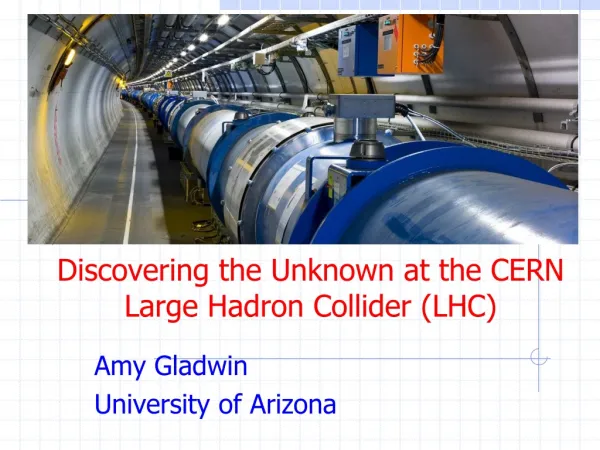
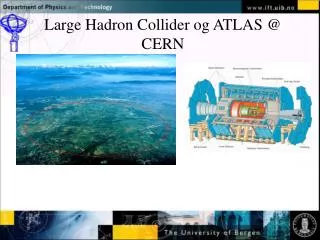
3rd Year Project Summary A new beam-profile monitor for the Large Hadron Collider at CERN. Project: Viscous Flow Analysis for Gas Curtain Formation. Ben Brown Matthew Budd Philippe Rottner. Project Aims and Definition. Collectively our aims are centered around the gas initialization:

E N D
3rd Year Project Summary A new beam-profile monitor for the Large Hadron Collider at CERN Project: Viscous Flow Analysis for Gas Curtain Formation Ben Brown Matthew Budd Philippe Rottner
Project Aims and Definition • Collectively our aims are centered around the gas initialization: • Ben - Compressible flow • Philippe - Condensation • Matthew - Gas jet/curtain modelling and optical instrument design Base diagram: Schematic of the supersonic gas jet beam profile monitor based on BIF - H. D. Zhang et al. “A Supersonic Gas-Jet Based Beam Induced Fluorescence Prototype Monitor for Transverse Profile Determination” (2017). Ben Brown
Compressible Flow Relations Basic Converging-Diverging (CD) Nozzle Design matched CD Nozzle Schematic from Marton Ady Ben Brown
Compressible Flow: Relations • The above equation is the basis for idealised compressible flow calculations. • Terms and their relevance: • Pressure ratio - predefined and therefore drivers the equation. • Density ratio - output to be minimised. • Mach number - output to be maximised. • Temperature ratio - a constraint. (1) Arrows not yet relevant Ben Brown
Compressible Flow: Relations • Converging-Diverging nozzles Area ratio drives the Mach number of the flow. • The leads to relations between Area ratio vs. Density ratio and Area ratio vs. Mach no. (2) Ben Brown
Compressible Flow: Basic Converging-Diverging (CD) Nozzle • An optimal Area ration can therefore be found if the importance of Mach number relative to density is known • Draw back • the shape/flow field direction is not factored in indico.cern.ch/event/712498/contributions/2926528/attachments/1619269/2575222/Nozzle_HighPressure_BGCMeeting_PS.pdf Ben Brown
Compressible Flow: Design matching CD Nozzle • Fully developed, non-choked flow falls into three categories: • Over expanded (e) • Design condition (f) • Under expanded (g) http://www.engapplets.vt.edu/fluids/CDnozzle/cdinfo.html • All nozzles seen in papers are Over expanded • Here the aim will be to achieve design condition • This will allow the flow field to be independent of distance between nozzle and skimmer https://en.wikipedia.org/wiki/Rocket_engine_nozzle#/media/File:Rocket_nozzle_expansion.svg Ben Brown
Compressible Flow: Design matching CD Nozzle (1-Dimensional) • Idealised design condition values • The inlet (P0) and outlet/chamber (P) pressure is used to drive the equations • Non-dimensional results • Dimensionalised results based on initial temperature (T0) and throat diameter (Dt) 1 2 3 Ben Brown
Compressible Flow: Design matching CD Nozzle (ANSYS Fluent Model) • 2-Dimensional nozzle with with geometry defined by equation 1 & 2 • Length of nozzle = 10 cm to encourage fully developed flow • Mesh build in ANSYS ICEM, model run in ANSYS FLUENT Ben Brown
Compressible Flow: Design matching CD Nozzle (ANSYS Fluent Model) • Distributions across the centre-line of the nozzle • Shape of static pressure curve indicates design condition being met • Mach number is significantly lower at exit M = 4.3 • Cluster formation is a function of static Temperature and Pressure http://www.engapplets.vt.edu/fluids/CDnozzle/cdinfo.html Ben Brown
Compressible Flow: Design matching CD Nozzle (ANSYS Fluent Model) Ben Brown
Compressible Flow: Possible Further Work • Investigate further the boundary at which compressible flow breaks down and molecular flow begins • Knudsen number • Model the flow through the first chamber in ANSYS Fluent to validate prediction of parallel streamlines Ben Brown
Condensation Phase diagram analysis Hypersonic flow considerations Philippe Rottner
When does condensation occur? Phase Diagram Analysis: • Is pressure and temperature above saturation line as seen in a phase diagram? • Condensation only initiated through formation of clusters or nucleation sites Hypersonic Flows Considerations: • Saturation line can be crossed without a change of state • Condensation can influence free-stream pressure, velocity and temperature • Design of nozzle is a factor due to nozzle expansion effects Philippe Rottner
What is a phase diagram? • Diagram of Temperature vs Pressure indicates the difference between states • Separate regions represent different phases: solid, liquid and gas • Saturation line/Phase boundary: denotes where 2 different phases meet • Can be expressed using Clausius-Clapeyron equation: • Triple point: where unique combination of pressure and temperature means that all three phases are present (3) Philippe Rottner
Phase Diagram: Nitrogen L S No condensation G We are here Phase diagram of nitrogen with logarithmic y-axis. Data from https://encyclopedia.airliquide.com/nitrogen Philippe Rottner
Phase Diagram: Neon L S No condensation G Phase diagram of neon with logarithmic y-axis. Data from https://encyclopedia.airliquide.com/neon Philippe Rottner
Is the flow hypersonic? • Results from Fluent indicate supersonic flow since M<5 • Nevertheless hand calculations indicate we may be in hypersonic flow regime In this case • For a fast enough flow expansion some non-equilibrium effects occur such as supercooling • Supercooling: gases at temperatures below equilibrium saturation, but no condensation • Study by Grossir and Rambaud helps us Philippe Rottner
Study by Grossir and Rambaud for hypersonic flows • All points are places where condensation is detected for different fluids and nozzle shapes - inside solid regions • Dashed curve is minimum temperature that can be achieved for condensation-free flows • There are points before the saturation line in gas region where condensation occurs BUT, the pressures are too high compared with what we have calculated Image: Comparison of air and nitrogen condensation onset. From G Grossir’s thesis: URL:https://www.researchgate.net/profile/Guillaume_Grossir/publication/281523360_Longshot_Hypersonic_Wind_Tunnel_Flow_Characterization_and_Boundary_Layer_Stability_Investigations/links/55ec23dd08ae21d099c5f418.pdf Philippe Rottner
Gas Jet/Curtain Simulation Model Description Model Results Optical State Measurement Scattering Types and Cluster Detection Wavelength/Power Optimisation Optical Instrument Design Performance Analysis Matthew Budd Top: Supersonic jet expansion schematic view, Heriot Watt University. http://dynamics.eps.hw.ac.uk/Molecular_Beams.php Bottom LHS and RHS: https://www.grc.nasa.gov/WWW/OptInstr/rayleigh.html
Gas Jet/Curtain Simulation: Model Description • Model quantifies gas apparatus design trade-offs. • Exploits θ-symmetry and parallel operations on large numbers (>107) of particles per simulation run. • Multiple runs to produce graphs. Matthew Budd
Gas Jet/Curtain Simulation: Results • Dimensions similar to Cockcroft apparatus, input density/velocity from ANSYS Fluent. • Input thermodynamic temperature: • Inverse relationship between input T and gas transmission. • No effect on density homogeneity. • End skimmer position: • Sets solid angle ∴ sets pass proportion and velocity dist. • Some effect on homogeneity, but whole density distribution is never very rectangular. Matthew Budd
Gas Jet/Curtain Simulation: Results • Repositioning second skimmer changes chamber extraction ratio. • Gas jet unaffected as long as laser power is kept under ~100W. • Ability to predict radial velocity from reading in the gas curtain: • Velocity differences in bulk direction will have the greatest uncertainty contribution. • There may be more complex effects due to particle collisions before skimmer 1. Matthew Budd
Gas Jet/Curtain Simulation Model Description Model Results Optical State Measurement Scattering Types and Cluster Detection Wavelength/Power Optimisation Optical Instrument Design Performance Analysis Matthew Budd Top: Supersonic jet expansion schematic view, Heriot Watt University. http://dynamics.eps.hw.ac.uk/Molecular_Beams.php Bottom LHS and RHS: https://www.grc.nasa.gov/WWW/OptInstr/rayleigh.html
Optical State Measurement: Scattering Types and Cluster Detection • Rayleigh scattering: from individual molecules and small clusters. Analytic scattering distribution. • Mie scattering: from large clusters of molecules. Scattering distribution computationally difficult. Scattering Distributions - Forward Direction Simulations run with CELES: CUDA-accelerated electromagnetic scattering by large ensembles of spheres. Egel A, Pattelli L, Mazzamuto G, Wiersma DS, and Lemmer U., Journal of Quantitative Spectroscopy and Radiative Transfer 199C (2017) pp. 103-110. Matthew Budd
Optical State Measurement: Wavelength / Power Optimisation • Maximising the number of detected scattered photons minimises measurement uncertainty. • N2 absorption is negligible above ~350nm. (5) Matthew Budd
Optical State Measurement: Wavelength / Power Optimisation • Maximising the number of detected scattered photons minimises measurement uncertainty. • N2 absorption is negligible above ~350nm. • Ne absorption lines occur across the spectrum. (5) Ne absorption spectrum information: NIST Atomic Spectra Database (v5.6.1) https://physics.nist.gov/asd Matthew Budd
Optical State Measurement: Optical Instrument Design, Laser Side • 405nm 1200mW laser diode in temperature controlled mount. • 2x cylindrical lens beam collimator for 3mm diameter. • Beam focus lens, f=300.0mm. • Translation stage, 0-150mm. • Laser steering 2-axis mirror galvanometer. • Gas apparatus laser-in viewport. • Class-4 beam dump. 2 5 6 3 1 4 7⟶ Matthew Budd
Optical State Measurement: Optical Instrument Design, Receiver Side • Gas apparatus scattering-out viewport. • FoV steering 2-axis mirror galvanometer. • FoV focus lens, f=300.0mm. • Translation stage, 0-150mm. • FPI alignment lens, f=200.0mm. • Scanning Fabry-Perot interferometer, 350-450nm. • Amplified / Avalanche Photodetector. 6 5 3 1 7 2 4 Matthew Budd
Optical State Measurement: Performance Analysis • Core:Velocity(±5%), Density (±5%), Temperature (±5K) • 4s sample time with 1mm3 resolution - 4s per mm3 • 40s sample time with (0.1mm)3 - 40000s per mm3 • Scanning Fabry-Perot interferometer would increase by a factor dependent on fabry-perot resolution/finesse. • These figures can be improved by a factor of 10-100 with more in-depth optical design to increase the solid angle of detection. • Measurement with Mie scattering-based cluster measurement: • Multiple measurement points required - at least 2. • Solving matrix equation with non-negative least squares. (6) (7) (8) Matthew Budd
Optical State Measurement * *Cannot actually measure the collider itself, just the gas jet and curtain. Matthew Budd
Optical State Measurement: Possible Future Work • In-depth optical design taking into account available equipment, exact apparatus dimensions and the measurement areas of highest interest. • Gather more cluster scatter simulation data - more combinations of angles and particle sizes. • Ideally >100 cluster sizes (106 ~ 109) - 100 runs. • Distribution of molecules in cluster - more in-depth than simple cubic packing. • Build and run experimental setup to verify computer models. Matthew Budd
Project Summary Questions?
Appendix I: Przemysław Smakulski’s data indico.cern.ch/event/712498/contributions/2926528/attachments/1619269/2575222/Nozzle_HighPressure_BGCMeeting_PS.pdf Ben Brown
Appendix II: Scattering Distribution Graphs Simulations run with CELES: CUDA-accelerated electromagnetic scattering by large ensembles of spheres. Egel A, Pattelli L, Mazzamuto G, Wiersma DS, and Lemmer U., Journal of Quantitative Spectroscopy and Radiative Transfer 199C (2017) pp. 103-110. Matthew Budd
Appendix III:Study by Grossir and Rambaud • Demonstrates condensation detection for different expansion rates • Expansion rates given by: • Conical nozzles with high expansion rates experience less supercooling that contoured nozzles (4) Image: Expansion rate effects on condensation. From G Grossir’s thesis: URL:https://www.researchgate.net/profile/Guillaume_Grossir/publication/281523360_Longshot_Hypersonic_Wind_Tunnel_Flow_Characterization_and_Boundary_Layer_Stability_Investigations/links/55ec23dd08ae21d099c5f418.pdf Philippe Rottner