Download
1 / 4
40 likes | 67 Vues
Charts displaying the enrollment and rescission data for Retail Electric Providers (REPs) based on IAG/IAL percentages of their total enrollments and switches. The charts show REP counts and enrollment/switch totals for different percentage ranges.

E N D
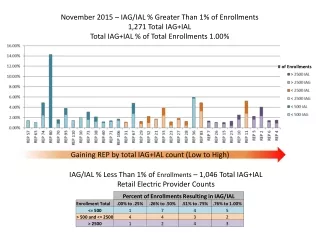
November 2015 – IAG/IAL % Greater Than 1% of Enrollments 1,271 Total IAG+IAL Total IAG+IAL % of Total Enrollments 1.00% # of Enrollments Gaining REP by total IAG+IAL count (Low to High) IAG/IAL % Less Than 1% of Enrollments – 1,046 Total IAG+IAL Retail Electric Provider Counts
Explanation of IAG/IAL Slide Data • The upper chart shows the REPs whose IAG/IAL percentage of their total enrollments is above 1%. • The purple shades show enrollment totals of over 2500 for the month being reported • The orange shades show enrollment totals of less than 2500 for the month being reported • The blue shades show enrollment totals of less than 500 for the month being reported • The REPs with the lowest count of IAG/IAL totals start on the left, and move to the highest counts on the right • The lower chart shows a count of REPs whose IAG/IAL percentage of their total enrollments is below 1%. • The Blue row shows counts of REPs that have less than 250 total enrollments by their percentage ranges • The Orange row shows counts of REPs that have greater than 250 and less than 1750 total enrollments by their percentage ranges • The Purple row shows counts of REPs that have greater than 2500 total enrollments by their percentage ranges
November 2015 – Rescission % Greater Than 1% of Switches 709 Total Rescission Total Rescission % of Total Switches 1.47% Gaining REP by total Rescission count (Low to High) Rescission % Less Than 1% of Switches - 49 Total Rescission Retail Electric Provider Counts
Explanation of Rescission Slide Data • The upper chart shows the REPs whose Rescission percentage of their total Switches is above 1%. • The purple shades show switch totals of over 1750 for the month being reported • The orange shades show switch totals of less than 1750 for the month being reported • The blue shades show switch totals of less than 250 for the month being reported • The REPs with the lowest count of rescission totals start on the left, and move to the highest counts on the right • The lower chart shows a count of REPs whose Rescission percentage of their total Switches is below 1%. • The Blue row shows counts of REPs that have less than 250total switches by their percentage ranges • The Orange row shows counts of REPs that have greater than 250and less than 1750 total switches by their percentage ranges • The Purple row shows counts of REPs that have greater than 1750 total switches by their percentage ranges