Download
1 / 12
120 likes | 212 Vues
Simulation of Microwave Induced Thermoacoustic Imaging Model using GPU. Nilangshu Bidyanta Ramaprasad Kulkarni ECE 562 Term Project. Project Overview. Introduction

E N D
Simulation of Microwave Induced Thermoacoustic Imaging Model using GPU NilangshuBidyanta Ramaprasad Kulkarni ECE 562 Term Project
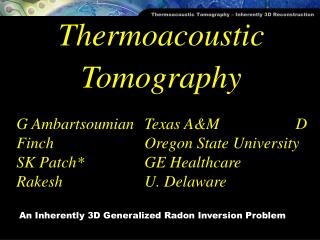
Project Overview • Introduction Figure: Schematic model (a) side view (the longer transverse dimension of the waveguide lies on the x-axis.) and (b) top view. Figure taken from reference [1].
Project Overview • Motivation • Hypothesis • Project goals
Methodology • Implementation of PSTD paper [Ref 1] • Existing Matlab code, wrote C++ code using CUDA
Methodology • Code analysis: A simplified version of the PSTD implementation can be written as follows: for(i=0; i<2000; i++) { Bx[i] = a*(Bx[i-1] + Bx[i-2] + Bx[i-3]) – b*myFunc(Cx[i-1], Cx[i-2], Cx[i-3]); Bx[i-3] = Bx[i-2]; Bx[i-2] = Bx[i-1]; Bx[i-1] = Bx[i]; . . Cx[i] = a*(Cx[i-1] + Cx[i-2] + Cx[i-3]) – b*myFunc(Bx[i-1], Bx[i-2], Bx[i-3]); Cx[i-3] = Cx[i-2]; Cx[i-2] = Cx[i-1]; Cx[i-1] = Cx[i]; . . } • In each iteration, the set of four equations for Bx is repeated for By and Bz and similarly for Cy and Cz. Also, the function ‘myFunc’ has FFT and IFFT computations.
Results and Discussions • Observed speedup w.r.t Matlab code • 11.84x speedup for GPU vs Matlab (2 core) • 2.68x speedup for GPU vs Matlab (6 core) • Due to significant amount of data transfers, the GPU speedup vsMutlicore machine is not significant. • Matlab was run on a 6-core Intel i7 machine and 2-core Intel Core 2 Duo machine runningWindows 7, 64-bit OS. • GPU code was run on a 4-core Intel Xeon machine running Linux 64-bit OS.
Results and Discussions • Limitation for further speedup is • Loop-carried dependency • Data intensive rather than computation intensive • Memory requirement increases exponentially • For 320x320x320 matrix, out of 3000ms for each iteration, around 2000ms is taken for data transfer • Data transfer time is significant compared to computation time.
Lessons learnt • Access to entire code, potential for further speedup • Serial computation on CPU can be improved by parallelizing the code to utilize multiple cores.
References • Wang, X.; Bauer, D. R.; Witte, R.; Xin, H., "Microwave-Induced Thermoacoustic Imaging Model for Potential Breast Cancer Detection," IEEE Transactions onBiomedical Engineering, vol.59, no.10, pp.2782-2791, Oct. 2012. doi: 10.1109/TBME.2012.2210218. • NVIDIA Corp. 2007. NVIDIA CUDA Compute Unified device architecture programming guide 1.1. Technical report, NVIDA, Santa Clara, CA
Questions Thank you