Download
1 / 13
130 likes | 139 Vues
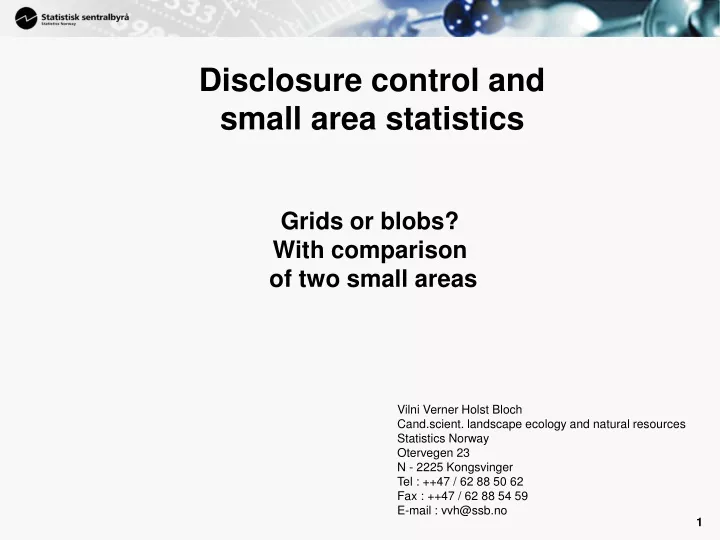
Disclosure control and small area statistics. Grids or blobs? With comparison of two small areas. Vilni Verner Holst Bloch Cand.scient. landscape ecology and natural resources Statistics Norway Otervegen 23 N - 2225 Kongsvinger Tel : ++47 / 62 88 50 62 Fax : ++47 / 62 88 54 59

E N D
Disclosure control and small area statistics Grids or blobs? With comparison of two small areas Vilni Verner Holst Bloch Cand.scient. landscape ecology and natural resources Statistics Norway Otervegen 23 N - 2225 Kongsvinger Tel : ++47 / 62 88 50 62 Fax : ++47 / 62 88 54 59 E-mail : vvh@ssb.no
Increasing demand for disclosure control Even smaller area statistics - easier to identify/recognice persons or communities More detailed statistics – more sensitive data More available statistics – easier to combine and derive other information (classic ex.: elder single person with lots of money)
Disclosure depend on geography (radius 75 m) Addresses Oslo municipality – 66 000 addresses (coordinate pairs) Persons
Disclosure varies with time and society Norwegian population cencus 1910 - about amongst others; returned norwegian-americans, dissidents, blind people, deaf people and lunitics
Advantages of grid Stable land units makes measuring change in geographical concentration easier (?) Measuring co-variation when lacking exact geographical match Easy data handling – do not need GIS
Advantages of blobs High geographical accuracy Easy to read – less ”noise” in the map
A comparison Stovner Central Oslo
Information on address level Stovner Central Oslo
Residents per 100 x 100 m gridcell Stovner Central Oslo
Employees per 100 x 100 m gridcell Stovner Central Oslo
Education in neighbourhood Stovner Central Oslo
Disclosure rules in Statistics Norway Blobs Statistics based on this method – given criterias of radius minimum 75 m, minimum 10 livingaddreses and 10 units – may be published. Grids Standard criterias for disclosure control yet to be decided. In practice minimum classes has been 1-4 residents or 1-19 employees.