Download
1 / 23
230 likes | 350 Vues
Changes in Corridor Operations: Results from Modelling REORIENT: Final Conference University of Maryland Brussels 31 May 2007. Organization of Presentation. Barriers to seamless operation Evaluating operational changes: REORIENT network modelling platform

E N D
Changes in Corridor Operations: Results from ModellingREORIENT: Final Conference University of MarylandBrussels 31 May 2007
Organization of Presentation • Barriers to seamless operation • Evaluating operational changes: REORIENT network modelling platform • Operational and service design scenarios • Border crossing time improvements • Terminal improvements • Infrastructure improvements • Scheduling constraints and priorities • The take-away: potential of operational changes
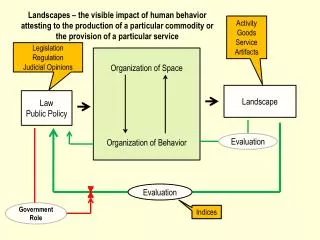
Network Modelling Structure Network Services Demand Schedule Design Mode and Path Choice Route Design IM Path Computation Assignment CDM Operation Rules Simulation Modal/Market Shares, by Service Travel Times, Terminal Delays Link Node
Dynamic Intermodal Simulation-Assignment Platform Port: Transfer of shipments from rail cars to ferry. Ferries move based on given timetables Intermodal Terminal: Shipment transfer from trucks to railcars Consolidationat Origin: Shipments to trucks. Destination: Unloading shipments Shuttle Service (for traditional trains): From terminal to classification yard i j Shuttle Service (for traditional trains): From classification yard to port Border Station: Train is delayed Classification Yard: Train assembly process. Not required for intermodal block trains. Classification Yard: Train is disassembled. For intermodal block trains, this process is not required. • Simulation-assignment method: • These processes are simulated to determine processing costs and times at nodes • and links of intermodal routes. • Shipments are assigned using joint mode and route choice assignment method. • Detailed representation allows us to test various policies, such as infrastructure • improvements, service frequency changes, and improvement in border crossing • procedures.
The REORIENT Network • Spans 23 countries • Rail portion (Nodes;Arcs)=(5577;5753) • Road portion (Nodes;Arcs)=(4713;5460) • Sea portion (Nodes;Arcs)=(54;21)
Demand within Network • Total # of shipments (base year): 3.2 million per week • 117 x 117 O-D zone pairs • 11 commodity types (unitized and bulk, for each)
Proposed Service Routes T1 = Green (Bulk) Swinoujscie - Vienna/Bratislava - Budapest T2 = Yellow (Unitized) Trelleborg-Swinoujscie-Bratislava/Vienna T3 = Red (Unitized) Gdansk/Gdynia-Bratislava/Vienna-Budapest-Beograd-Thessalonica T4 = Blue (Bulk and Unitized) Bratislava-Budapest-Bucharest-Constantia
Proposed Services • New rail services on current network • New rail services on improved network • Multi-voltage locomotives • Improved signaling (e.g. ERTMS) along route from Gdansk to Thessaloniki • ICT for improved border station performance • 20% increase in speeds in Poland • Electrification of all tracks on proposed services
Potential Market for Proposed Rail Services 112% increase in rail freight demand 71% increase in rail freight demand
Services: Catchment Area(Origins of shipments using new services) Scenario 2 Scenario 9
Does Greater Access Increase the Proposed Rail Services’ Attractiveness? 33% increase In rail freight demand
Do Border Crossing Delays Hinder Rail Utilization? Before improvement After improvement
Infrastructure Improvements Improved signaling 20% increase in speed in Poland Electrification of all track along proposed services Terminal processing time improvement 12.8 % increase in intermodal rail freight flows in overall REORIENT network
Market Opportunity for Rail Services Running during Day Time?
Relaxing Time of Day Scheduling and Priority Constraints Approximately 20% increase in intermodal rail freight in overall REORIENT network Better than doubling of demand for new services
How to pay for improved infrastructure? Breclav Station Streamlined border crossing Budapest Terminal Better equipment, more efficient handling
Doubling Infrastructure Charges… Leads to • estimated 15.5% reduction in total demand (flows in tons) • though still 69% increase in revenues to pay for improvements Improved Network Current vs. Increased Charges (2006 Base Demand)
Concluding Remarks • Improved border operations, infrastructure improvements, greater access to services, relaxing scheduling constraints have considerable potential to increase intermodal rail share. • Further improvement possible through more sophisticated operation of the rail network to allow more efficient priority allocation to different services. • Managing the rail system in the 21st Century will require new management models. Most promising models will be based on collaborative decision-making architectures. x 2
For more information on Network Modeling Platformvisit demonstration during break