Download
1 / 22
220 likes | 593 Vues
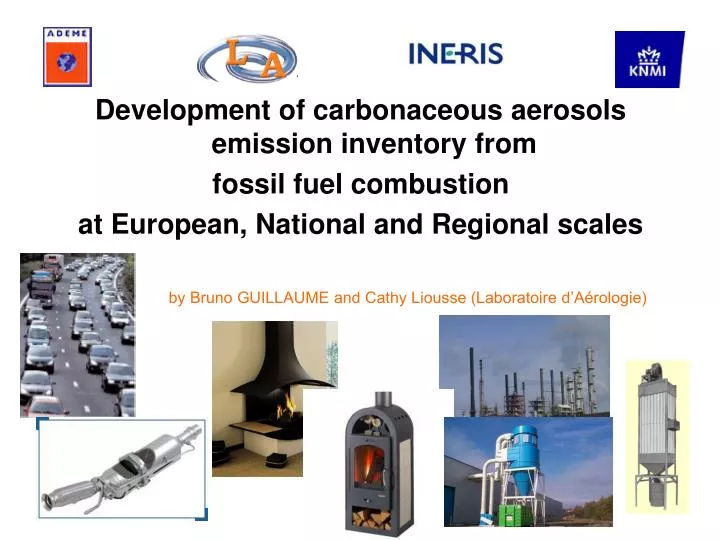
Development of carbonaceous aerosols emission inventory from fossil fuel combustion at European, National and Regional scales by Bruno GUILLAUME and Cathy Liousse (Laboratoire d’Aérologie) Outline

E N D
Development of carbonaceous aerosols emission inventory from fossil fuel combustion at European, National and Regional scales by Bruno GUILLAUME and Cathy Liousse (Laboratoire d’Aérologie)
Outline 1). To Develop a new european emission inventory (EI) for BC and OCp (NEWEUR), to improve understanding of the largest differences in the existing EI (and there are !) 2). To simply relate these differences to the source/fuel types and emittive regions 3). To compare model/measurements BC concentrations obtained with NEWEUR and existing EI separately introduced in TM4 model
HOW MUCH DO FOSSIL FUELS + BIO FUELS CONTRIBUTE IN EUROPE TO BC ANTHROPOGENIC EMISSIONS ? BC (ff+bf) J&L (2006) EVOLUTIVE EF BC (agric. waste burning) BC (boreal fires) BC (tropical fires) 0 200 500 2500 10000 40000 100000 150000 tons/yr/3°x2°
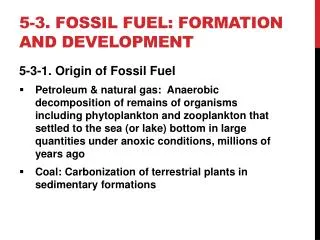
DERIVING THE EMISSIONS OF BC AND OCp large split of technologies under-developed emission controls semi-developed developed Pros Pros 1). « lev.dev. »-dependent: accounting for both « TECHNOLOGY » and « TECHNOLOGY USAGE » 2). Choice of EF based on real measurements of EF(BC) and EF(OCp) « technology-based » with a large diversity of technologies Cons Cons 1). A lot of techno but not enough measurements 2). Choice of EF(BC) and EF(OCp) based on EF(PM) and estimates of submicronic, BC/PM and OCp/PM fractions EF not accounting for norms after 1990 in Cooke et al. (1999) Now corrected in Junker and Liousse (2006) Particularly large differences in Europe (Schaap et al., 2004), a region where emissions are often supposed to be rather controlled [Cooke et al, 1999; Junker&Liousse, 2006] or [Bond et al., 2004] ? Cooke et al, J&L Bond et al Fuel- And activity-dependent emissions Large differences at global scale
OBJECTIVE HERE : IMPROVING J&L’s BC AND OCp INVENTORIES IN EUROPE (Guillaume&Liousse, 2006, in prep.) Replacement of « lev.dev. based » approach by « technology-based » approach in Europe, assuming: TECHNOLOGY USAGE less critical parameter in Europe than in developing countries MAJOR CHANGES in EF vs. Cooke et al. (1999) in domestic diesel (-), trafic diesel (-), lignite (-) 3). For other technologies in NEWEUR, EF derived from : EF values for REF technology variations of CO/CO2 relatively to REF value of CO/CO2 « CO/CO2 method » : CO/CO2, as an indicator of combustion completeness High impact on EF(BC, OCp) for biofuels (fireplaces > stoves), for industrial coal,lignite (fbc<pc<grate) BUT Low impact on coal emissions (pc is major contributor) Low impact on road diesel (pass car ~ trucks ~ buses) High impact on road gasoline (pass cars < 2-strokes) 4). EF controlled derived from: EF uncontrolled abattement factors (IIASA) (fuel & tech dependent) Very large impact on road diesel (Euro norms) NEWEUR 1). Use of IIASA fuel-consumption dataset (Klimont et al., 2002) for years 1990,1995,2000,2005 and 2010 (detailed by controlled/uncontrolled fractions) 2).Choice of EF(BC, OCp): for some uncontrolled tech. (REF technologies) EF are taken equal to J&L’s EF for semi-dev countries: i).ΔEF(BC) linked toΔ(CO/CO2): the more complete the combustion (low CO/CO2), the lower EF(BC) ii).Δ(BC/OCp) linked to Δ(CO/CO2): the more complete the combustion, the higher BC/OCp.
RESULTING EF NEWEUR vs. Bond: Main differences in coal EF (dom, indus) and lignite
TOTAL BC EMISSIONS IN EXISTING EUROPEAN EMISSION INVENTORIES
SPATIALIZED BC EMISSIONS COMPARED TO EXISTING INVENTORIES – YEAR 1995 BC emissions by NEWEUR (no control scenario) BC emissions by J&L (2006) (EF 1990) BC emissions by NEWEUR (with controls scenario) BC emissions by Schaap et al. (2004) BC emissions by J&L (2006) (EVOLVING EF) 0 200 500 2500 10000 40000 100000 150000 tons/yr/3°x2°
FOCUSING ON FUEL/SECTOR TYPE… Germany – 5.5 Gg/yr Germany – 7.2 Gg/yr Poland – 5.9 Gg/yr Poland – 10.2 Gg/yr Germany – 19.4 Gg/yr Germany – 2.5 Gg/yr Poland – 53 Gg/yr Poland – 98 Gg/yr Industrial sector Domestic sector Combined sector (mobile sources) In Schaap et al. (2004) inventory 260 Gg/yr 90 Gg/yr 86 Gg/yr In NEWEUR inventory 1). LESS THAN 20% DIFFERENCES IN EU-COUNTRIES (in agreement with Kuppiainen and Klimont, 2006) 2). 50% (DOM.) -80%(INDUS.) DUE TO UNCERTAINTIES ON POLAND VALUES URGENT NEED FOR BETTER EF VALUES FOR COAL / LIGNITE (DOMESTIC AND INDUSTRIAL) !! 300 Gg/yr 190 Gg/yr 220 Gg/yr
ROAD TRAFFIC: STRONG VARIATIONS AT REGIONAL SCALE ? Degradate at 25kmx25km 61 Gg/yr kt/an/10kmx10km kt/an/25kmx25km kt/an/10kmx10km kt/an/1kmx1km 30 30 30 0.3 12 0.1 12 12 6 6 0.06 6 4 0.04 4 4 0.03 3 3 3 2 2 2 0.02 1.5 1.5 0.015 1.5 60 Gg/yr 1 0.01 1 1 0.4 0.004 0.4 0.4 European France 25kmx25km 0.1 0.001 0.1 0.1 0.00025 0.025 0.025 0.025 0.005 0.005 0.005 0.00005 0.002 0.002 0.00002 0.002 0 0 0 0 Similar emissions, better spatialisation 2.7 Gg/yr 3.6 Gg/yr Escompte zoom at 10kmx10km Better spatialisation + Total emissions increased (20% more) Road contribution increased from 48% to 58% + Importance of maritime emissions Improved BC road emissions in Marseille region - improved location (Escompte program 1999-2001) 1kmx1km (thanks to AASQA Airmaraix - LPCA) Improved BC road emissions for France (10kmx10km) by improved location (SNAP3) from CETE (improved vehicle counts for highway, urban, rural driving) 60 Gg/yr Guillaume and Liousse (2006b), submitted to J. Geophys. Res.
CHECK OF BC CONCENTRATIONS AGAINST MEASUREMENTS
USE OF A GLOBAL BC MODEL TO TEST NEWEUR AGAINST EXISTING INVENTORIESs Use is made of TM4-tracer = tracer version of ORISAM-TM4 model (Guillaume et al., Tellus B,2006): • - global tracer model (300x200km resolution), • - long integrations, • - 9 vertical levels (up to 40hPa), • dry dep (Ganzeveld, 1997), • wet dep: convective rains (Guelle, 1995) / stratiform rains • (incloud and below cloud), • BC ageing (Cooke et al., 1999). ORISAM-TM4 GLOBAL (300x200km, long integrations)
MODEL APT TO REPRODUCE TEMPORAL EVOLUTION OF BC CONCENTRATIONS Pic du Midi (avril 2002-août 2003) EC/OC Campaign (july 2002- july 2003) (see next talk by D. Simpson) Guillaume et al. (2006b), submitted to Geophys.Res.Lett. Photo des filtres: août 2002 à dec 2003
OC MORE PROBLEMATIC : MODEL ORISAM-TM4 SHOWS THE INTEREST OF MODELLING SOA IN OC Pic du Midi (April 2002-August 2003) Guillaume et al. (2006c), submitted to Geophys.Res.Lett.
RUNNING SEPARATE BC SIMULATIONS Embedded separately Rest of world = J&L’s inventory • 2 different European inventory: • Schaap et al. (2004) (EF based on Bond et al.) • NEWEUR (with controls)
EUROPEAN STATIONS TO COMPARE MODELED / MEASURED CONCENTRATIONS Lack of data in the zones where emissions are really problematic ! Hyytiala NEatlantic Aspvreten South Uist Kap Arkona Roervik Mace Head Potsdam Edgbaston Gent Radebeul Halle Gorlitz Melpitz Paris Gif-sur-yvette Vienna K-putsza Landes Forest Po valley Areao Corsica Anadia Barcelona Aveiro Ebro Lisbon
EUROPEAN STATIONS TO COMPARE MODELED / MEASURED CONCENTRATIONS Western Europe: global modelling agrees well Central Europe: better reproduction with NEWEUR NEWEUR Less dispersion with regional model OBSERVATIONS Roervik SCHAAP IN LOTOS SCHAAP Hyytiala NEatlantic Aspvreten South Uist Kap Arkona Mace Head Potsdam Edgbaston Gent Radebeul Halle Gorlitz Melpitz Paris Gif-sur-yvette Vienna K-putsza Landes Forest Po valley Areao Corsica Anadia MOST OF THE DIFFERENCES AT CENTRAL EUROPE SITES, WITH BETTER AGREEMENT USING OUR NEW INVENTORY Barcelona Aveiro Ebro Lisbon
CONCLUSIONS AND PERSPECTIVES Combustion chamber (LA, Lannemezan) • New measured EF(BC,OCp) soon available • (Lannemezan, 2007) for coal species (lignite, coal, coke) • and peat + further validation of the CO/CO2 method Irish peat German lignite • Uncertainties in European BC emissions generated mostly by uncertainties • in Central Europe emissions and attributable to coal emissions • (domestic and industrial combustions), • TM4 simulations show improved comparison with • NEWEUR in Central Europe (but lack of data), • Regional zooms point to higher regional uncontrolled fractions • of road traffic. • Need for regionalisation of inventories • emphasized by this study
BC and OC = primary carbon species in mixed aerosols Radiative forcing (IPCC, 2001) BC (local heating effect) OC (local cooling effect) BC and OC = combustion tracers, products of incomplete combustion Chemically very complex species HAP agglomerates, condensed organic fonctions, polymerized organic matter) secondary OC (SOA) Carbon continuum Condensation continues in the atmosphere emissions OCp BC EC